As today’s session closes out on the benchmark S&P 500 (SPX) as an indecisive spinning top candlestick with bulls failing to press yesterday’s attainment of all-time highs, here are several similarly disconcerting charts that have been on watch the past several sessions.
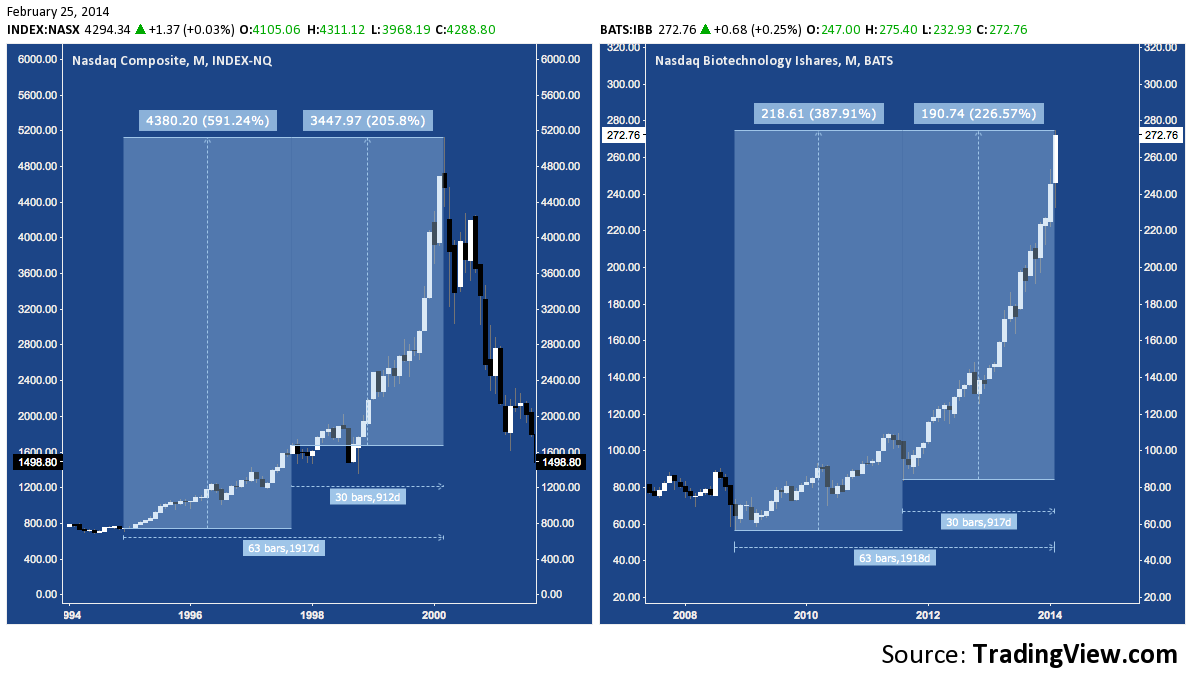
Over the weekend I did a couple of write-ups, giving separate cases supporting a measure of technical pessimism for the NASDAQ (NDX and the Composite) and Biotech. Juxtaposing COMPQ and IBB again, here’s a comparison of the 5 and 2.5 year periods preceding March 2000 in the Composite; and the 5 and 2.5 year periods preceding today in Biotech. Amazingly, IBB‘s performance over the shorter period outperforms even the storied run of 1998-1999. Tweaking the timeframes can also yield results where the COMPQ comes out on top, too; but the spirit of the comparison remains intact as IBB continues to measure up formidably.
NASDAQ Composite (COMPQ) v. Biotechology (IBB)
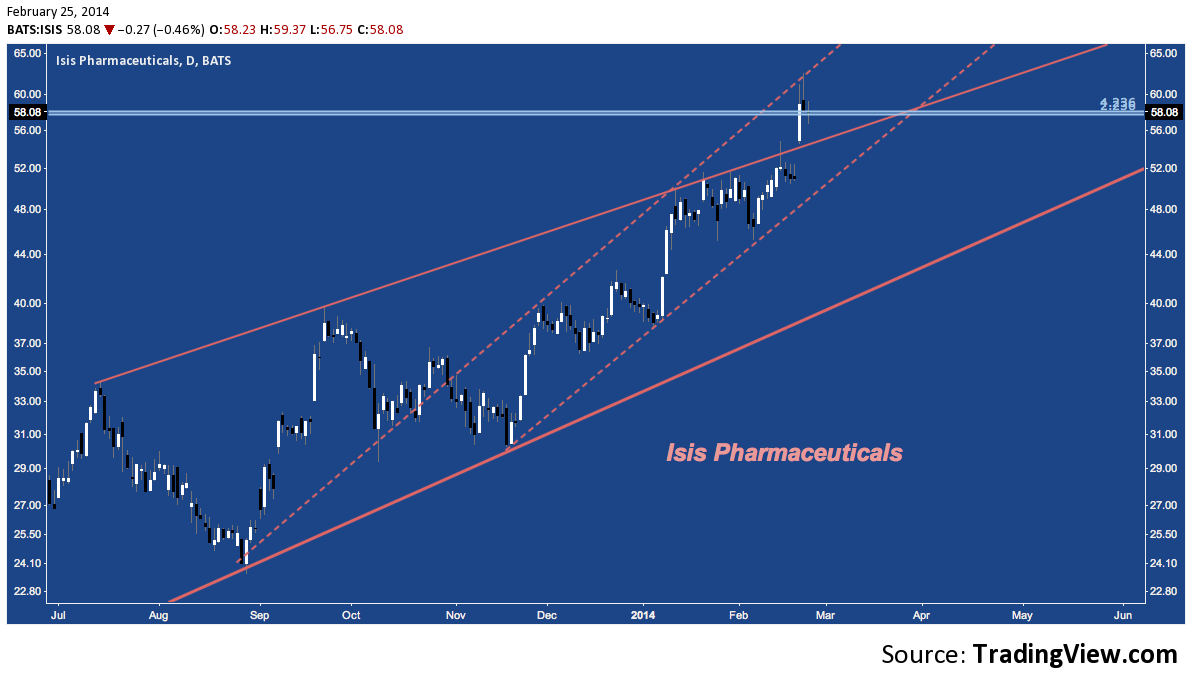
ISIS Pharmaceuticals (ISIS) is one of the more popular stocks driving interest in the biotech space. It jumped it’s rising channel late last week, smacking into (more acute) rising channel resistance at a long-term fibonacci cluster level. The doji it features today is being replicated on quite a few big biotech names, even while other Biotechs (e.g. ITMN, posting a knee-slapping +160% today) are holding up very well. Whether these dojis are indicative of a brief pause only or the beginning of a pullback is something I’ll be keeping a close watch over.
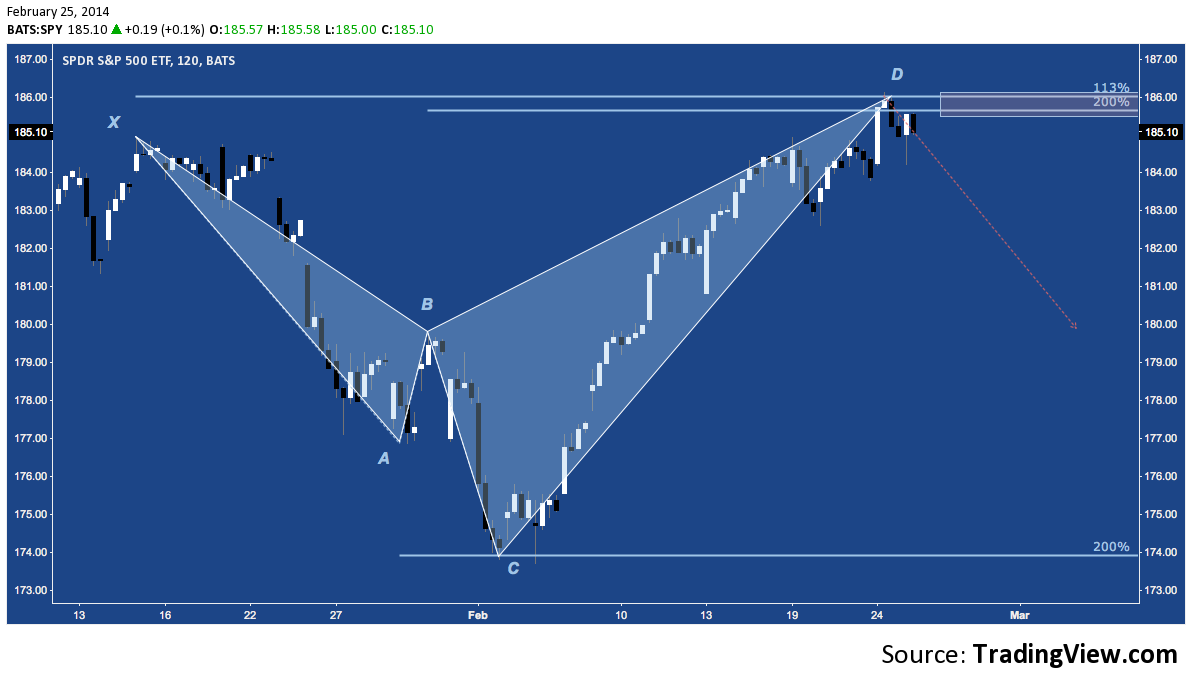
S&P 500 (SPY) has been winding through a Bearish Shark harmonic pattern since bottoming 3 weeks ago 11 points lower. The benchmark reached it’s potential resistance zone as it marked new all-time highs yesterday, entering a brief consolidation with today’s session. If SPY does resolve lower from 185-186, 180 at point B is it’s primary downside objective.
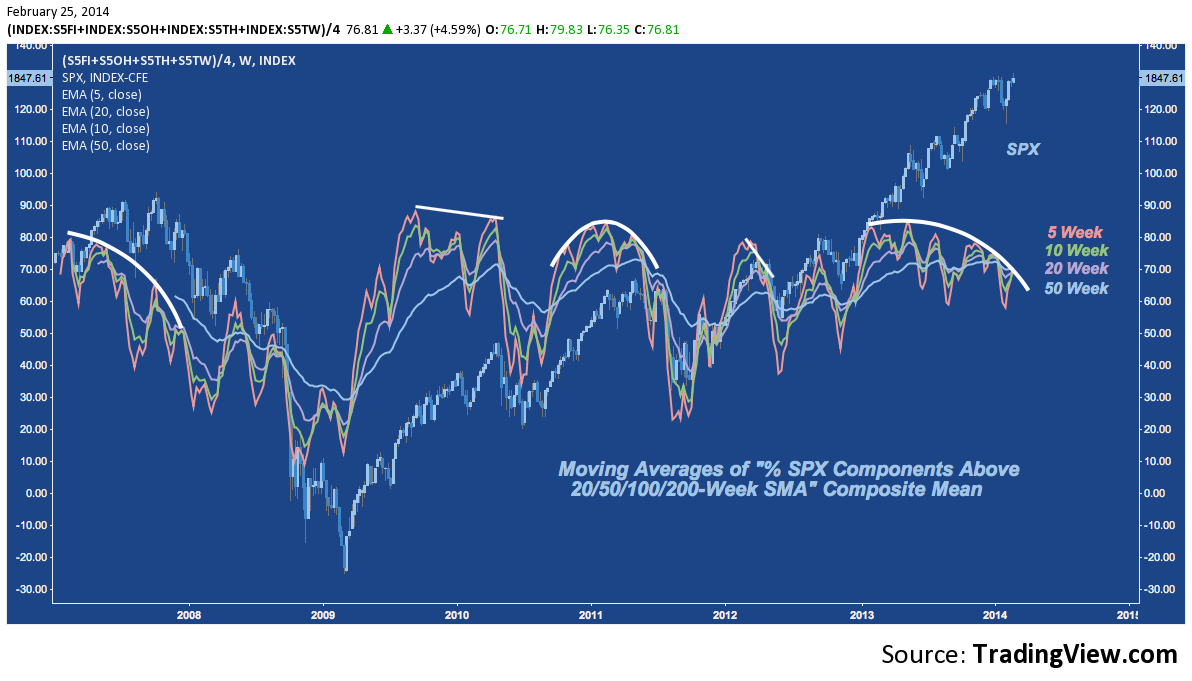
S&P 500 (SPX) – Analyzing Moving Averages of “%>x-SMA” Participation
Since mid-last year I’ve periodically checked in on a more unconventional breadth chart that 1) averages the most commonly-cited “% of S&P 500 Components above their x-SMA” measures (i.e. 20, 50, 100 and 200 period) and then 2) further averages this line with 5, 10, 20, and 50-week EMAs. In short, this chart consolidates these disparate time frames to provide an average of average participation. It’s oscillations have been coincident with the higher highs the S&P 500 has produced since the beginning of 2013; but consistently producing lower highs. This indicates that participation in aggregate is falling across time frames. Similar occurrences occurred in early 2012, early-2011, mid-2009 to early 2010, and finally in 2007/2008.
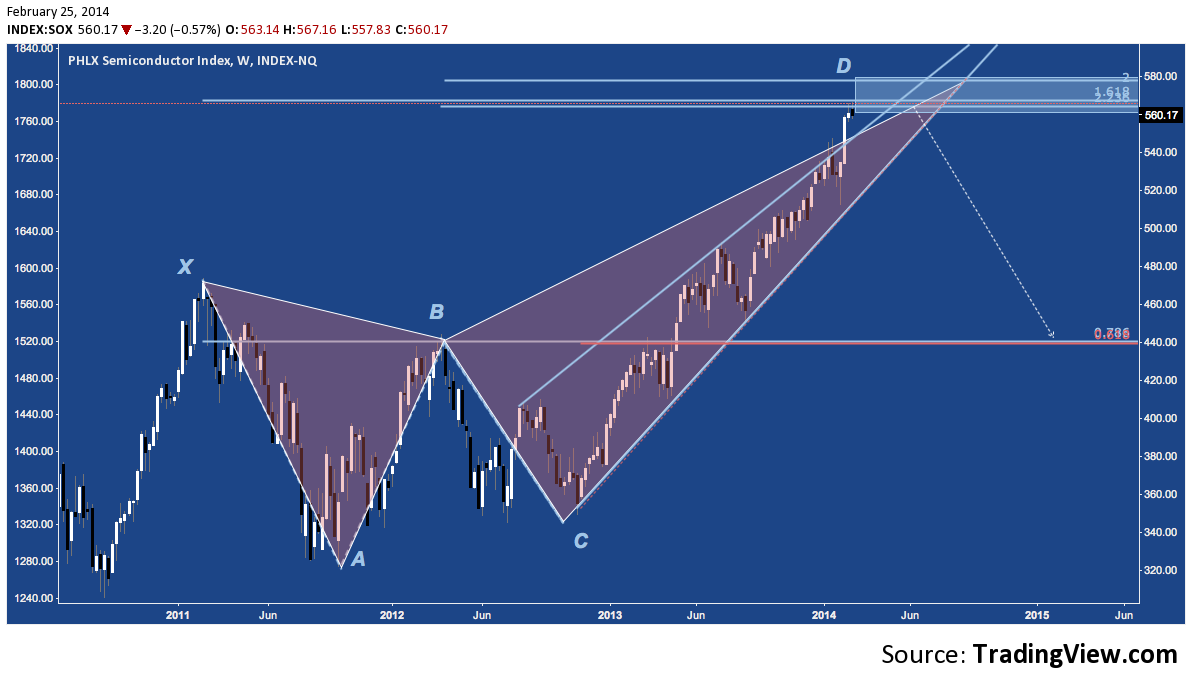
PHLX Semiconductor Index (SOX) – Bearish Butterfly
The SOX broke it’s 15-month rising wedge to race into its 3-year Bearish Butterfly potential reversal zone between 560-580. Last week’s attempt to trade well into this resistance level was repelled, while this week is off to a similarly lackadaisical start. This pattern carries major implications if it turns; with a tentative downside objection more than -20% lower.
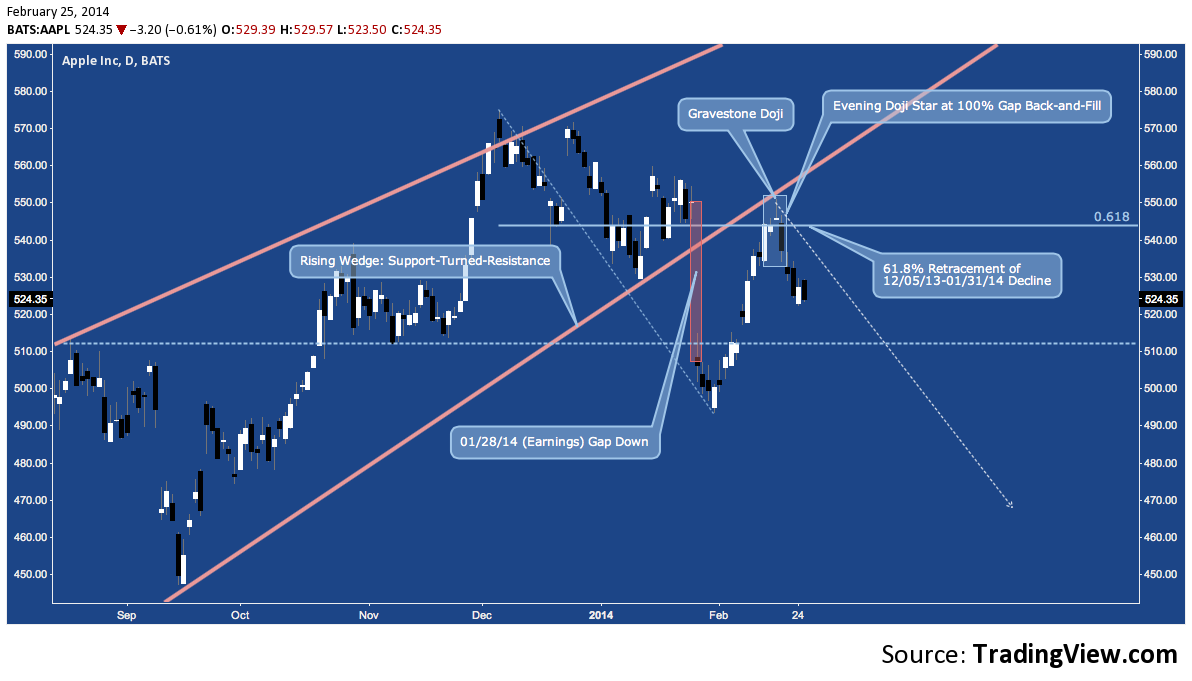
Tech continues to receive little help from Apple (AAPL). The consumer electronics monolith completed an evening doji star pattern early last week; and true to advertising, the stock has proceeded lower from the pattern’s completion at $537.27. See It Market impresario Andy Nyquist’s read on AAPL Sunday did a great job of breaking down the stock’s most important short-term levels. In the medium-term, a break beneath $490 looks toward an ABCD target between $465-$470. As Andy explains, the post-Q4 earnings high near $550 and then early December’s high near $580 remain the levels to beat to see a sustained resumption of AAPL‘s uptrend.
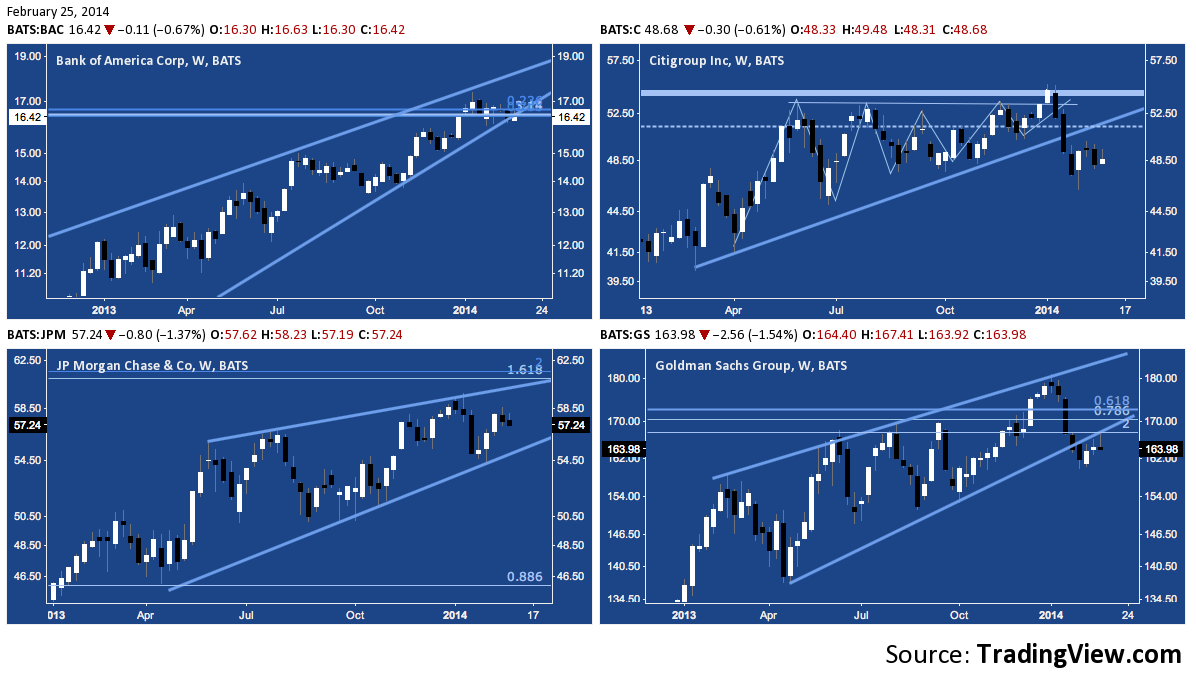
Too Big Too Fails
Big banks continue to underwhelm. Only fractionally back toward the local highs they set in January with the S&P 500, each of these banks are in varying states of early-stage technical deterioration. Bank of America (BAC) is testing 5-year rising wedge support. Citigroup (C) broke down hard from a new 5-year high in early January through ascending triangle support and shows little sign of recuperating. Goldman Sachs (GS) snapped 2013’s rising channel and has failed in 10 consecutive daily attempts to retake it. JP Morgan (JPM) is holding up comparatively well, but it hasn’t exceeded the 78.6% retracement back to it’s January highs and is beset (as each of these are) by longer-term structural resistance just above $60. Check out the longer-term top-down study of the challenges these banks are facing here.
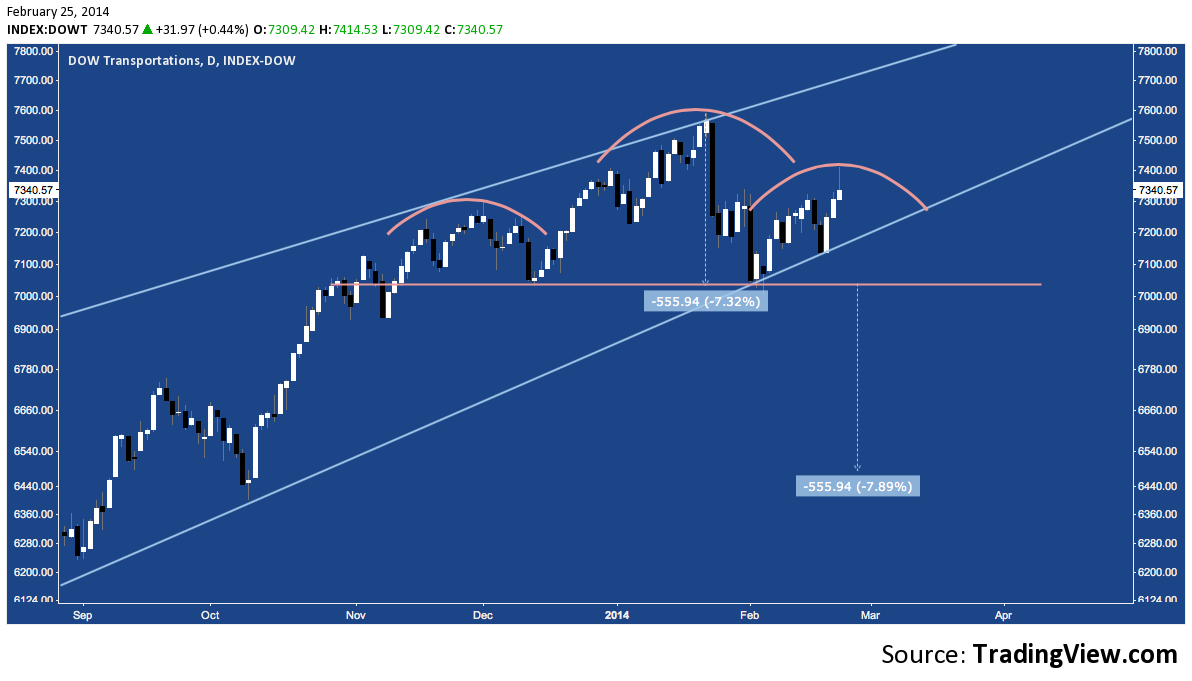
Dow Transports (DJT) – a huge winner in 2013 – bounced off 15-month channel resistance in early January and in its staggered attempts to recover has since built out the right shoulder of a potential head & shoulder’s top. Below 7050, the index targets another -9% drop to ~6450.
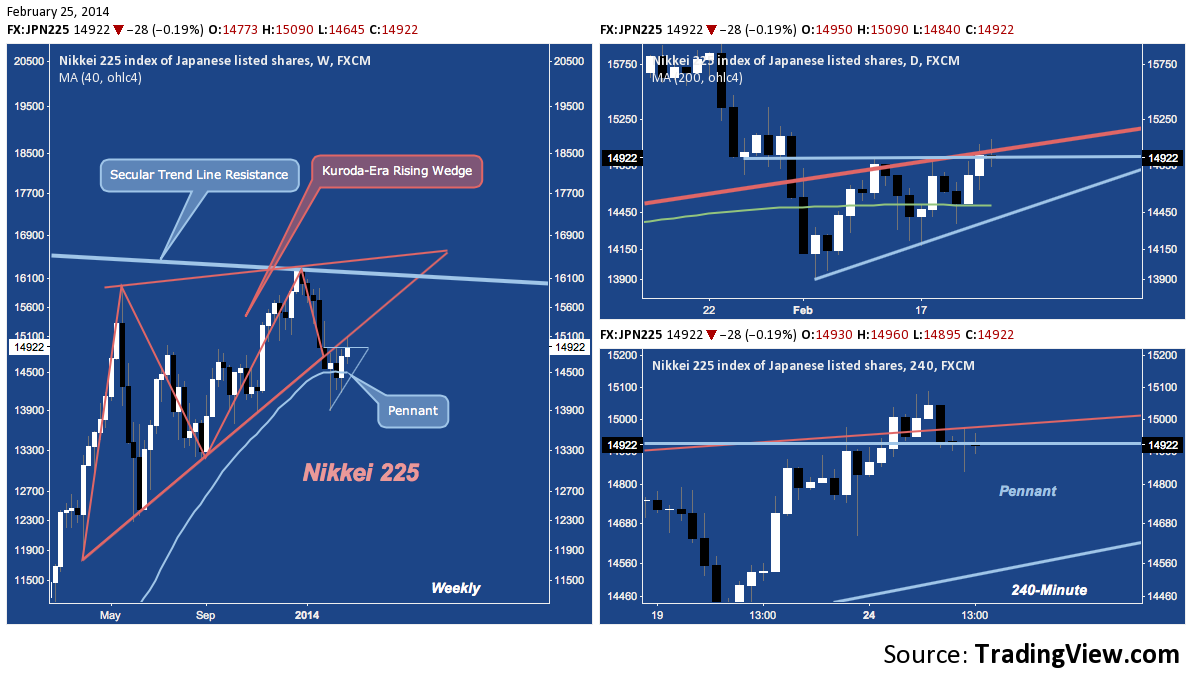
Japan’s Nikkei225 equity index broke down hard from secular trend line resistance in December, snapping its Abenomics-era rising wedge (check out miss Andy Nyquist’s analysis of the Nikkei and its performance v. the S&P 500) and 200-Day SMA at its worst in early February. In the 3 weeks that have elapsed since, NKY has installed an ascending corrective triangle. Yesterday, the index broke above triangle resistance mid-session only to close on it, creating a indecisive spinning top. How this triangle resolves will determine whether the rising wedge support (orange) lost 3 weeks ago is recovered. If it falters instead, the Nikkei faces it’s 200-Day yet again (near 14450), with triangle support just below. Beneath there, the air opens up quickly to the mid-13000s.
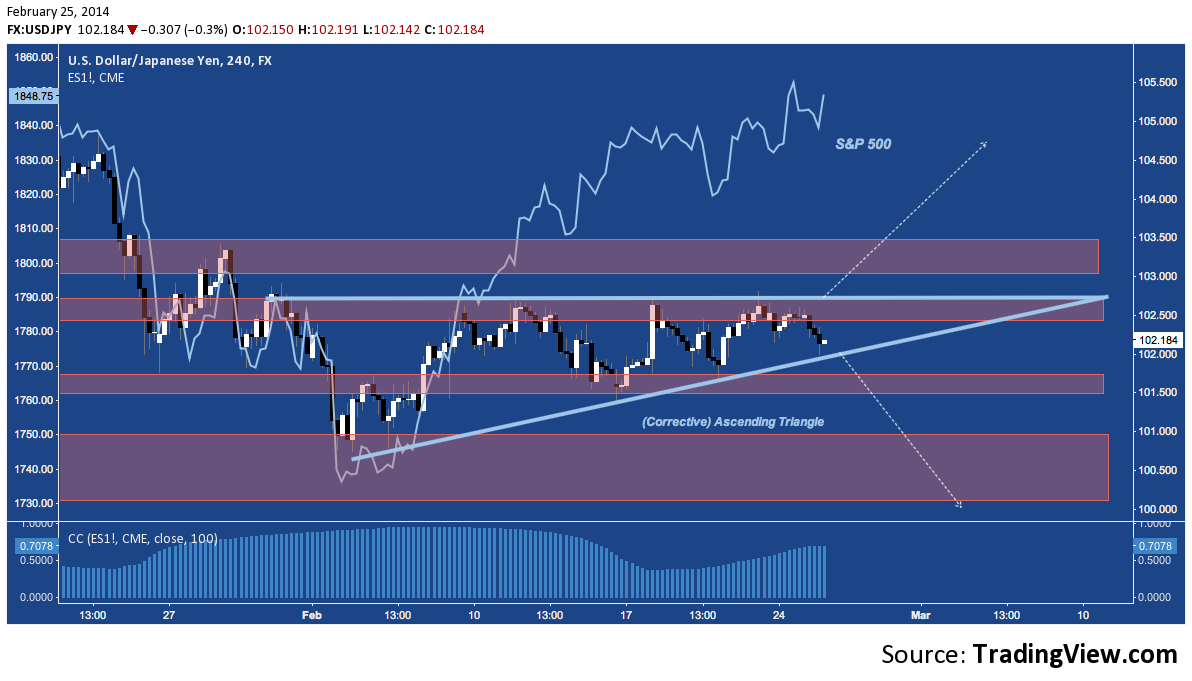
USD/JPY – Ascending Triangle
No analysis of the Nikkei is complete – right now, anyway – without a mention of the USD/JPY. Also pressing through an ascending triangle since the beginning of February, the US Dollar/Japanese Yen is entering the prime window for a breakout. Over 102.70 or below 101.50, USD/JPY targets 105 or 100, respectively. The Forex pair’s positive correlation to the S&P 500 faltered a bit last week as the recent historic string of consecutive up-days factored in heavily. But with the correlation re-syncing, it looks as though the S&P 500, USD/JPY and perhaps even the Nikkei may break higher or lower together in the next few sessions.
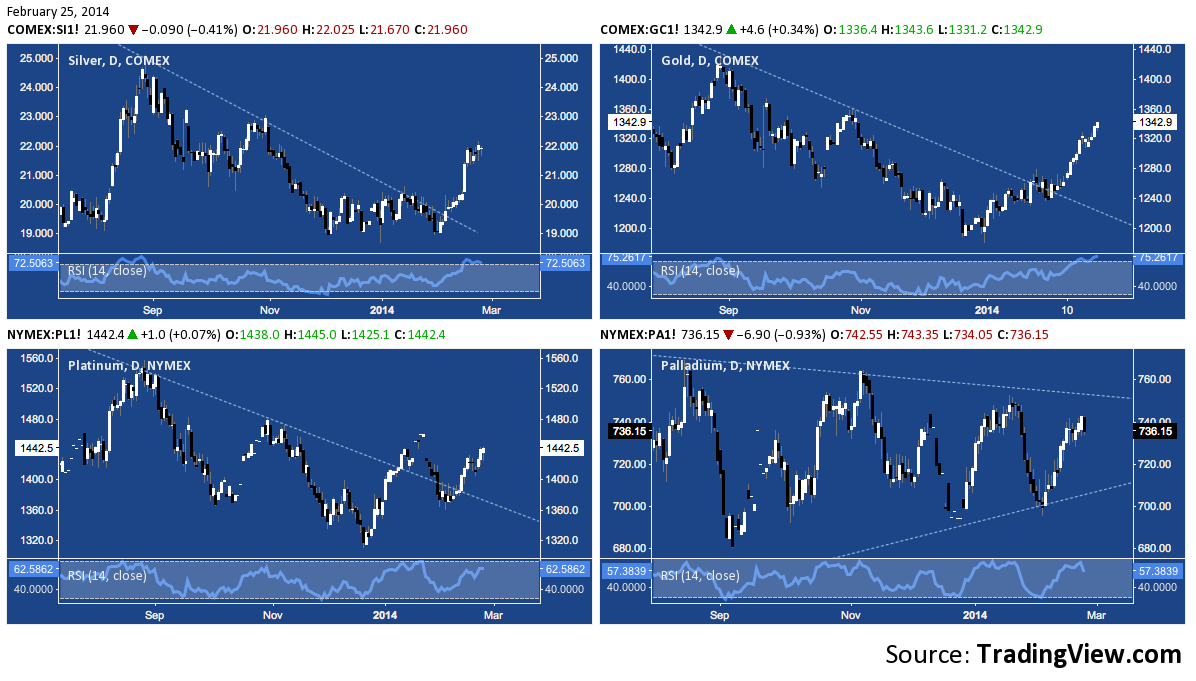
Precious Metals – Gold (GC) and Silver (SI) primarily – have had a fantastic run since the beginning of February, with Gold and Silver breaking major medium-term descending trend lines and Platinum breaking, losing and then recovering it’s own descending trend line break. Even Palladium bounced at trend line support below $700 and is now nearing trend line resistance of a broad symmetrical triangle near $750. Silver and Gold are each ticking into overbought territory after their strongest sustained runs in months. The entire complex looks due for some further consolidation, but the broad strength evident here continues to look constructive.
Trade ’em well.
Twitter: @andrewunknown and @seeitmarket
Author holds no exposure to instruments mentioned at the time of publication. Commentary provided is for educational purposes only and in no way constitutes trading or investment advice.
“Spinning Top” image courtesy stockarch.com
Any opinions expressed herein are solely those of the author, and do not in any way represent the views or opinions of any other person or entity.


