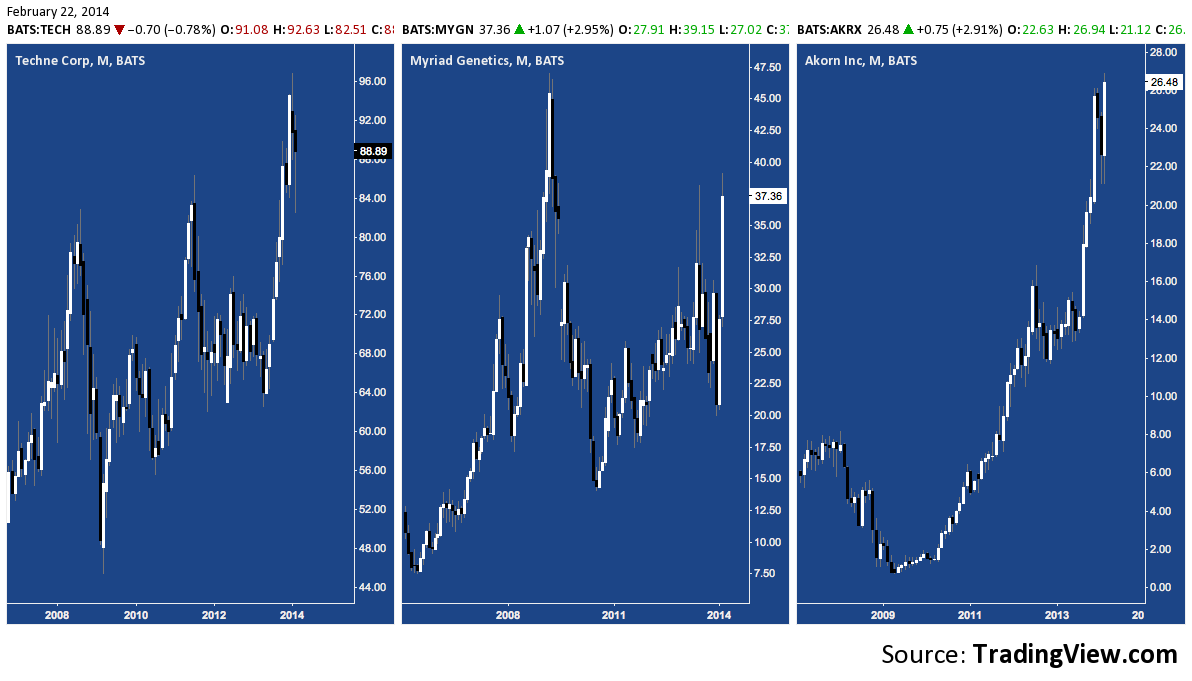
What’s left to be said about the quickening madness that has every appearance of spooling into a classic mania in Biotech stocks? Sean McLaughlin summed up the current environment well when he wryly observed yesterday on the Stocktwits blog that “We might never know why, but make no mistake, risk is ON in the biotech sector.”
There’s a transitional passage in some trends where momentum so wrests control from theses of value investing and fundamentally-based arguments that all stocks in an industry are deemed worthy of indiscriminate buying. Where higher prices once created an aversion to accumulating, they now incite a rapturous compulsion to buy.
The reasons for this are almost entirely social: when the market crowd becomes so inebriated on animal spirits, its speculative fervor just doesn’t allow for contemplative pauses to ask why.
It doesn’t have to.The impulse to buy at any cost seems a prudent choice. That “risk is ON” and a group of stocks is screaming higher is so manifestly true and obvious that their steadily rising prices become eo ipso reason enough to buy.
But by definition, any trend that becomes so axiomatic for the market that not participating seems obscene has entered its latter days.
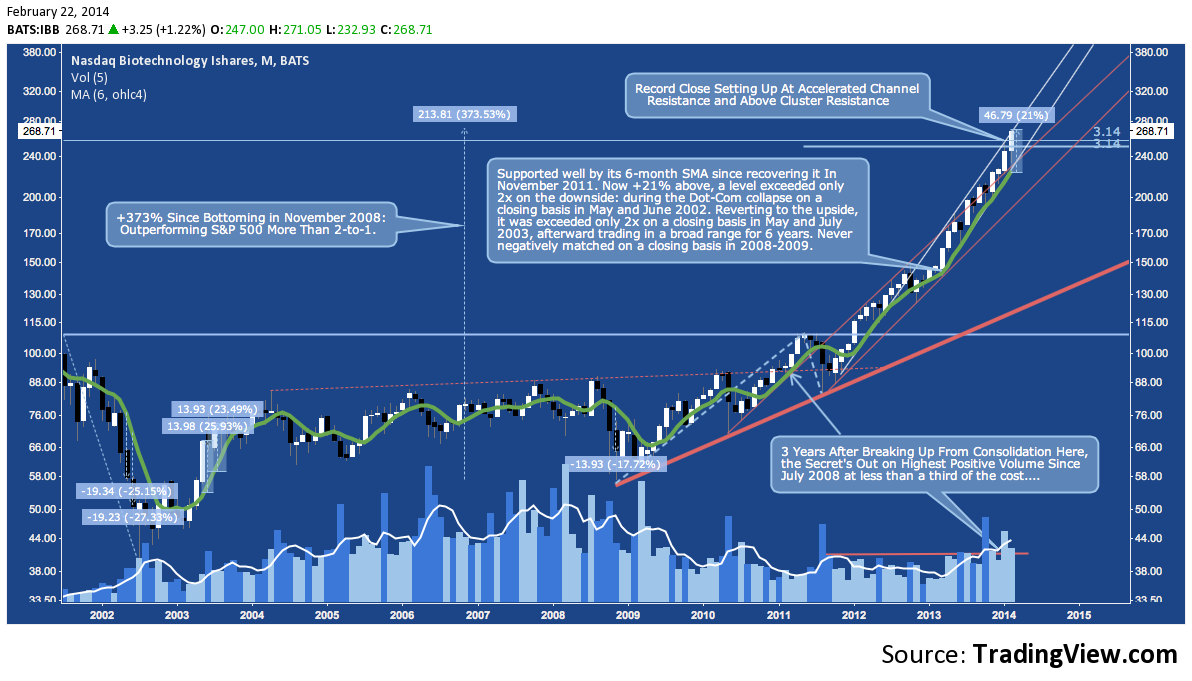
That funereal tone isn’t an invitation to short – it’s contrarian enough to be circumspect about existing and new long positions. Check out the interest flooding into the iShares Biotechnology (IBB) ETF (also see the SPDR S&P Biotech ETF, XBI) where accumulative volume is as high as it was in mid-2008, but now chasing shares more than 3x as expensive. Closing last week above cluster resistance and at the top of its steepest channel yet, IBB is more extended from its 6-month SMA (green) than at any other time except into the death throes of early 2002 and during the post-Dot-Com reversion rally of early 2003.
iShares NASDAQ Biotechnology (IBB): Monthly
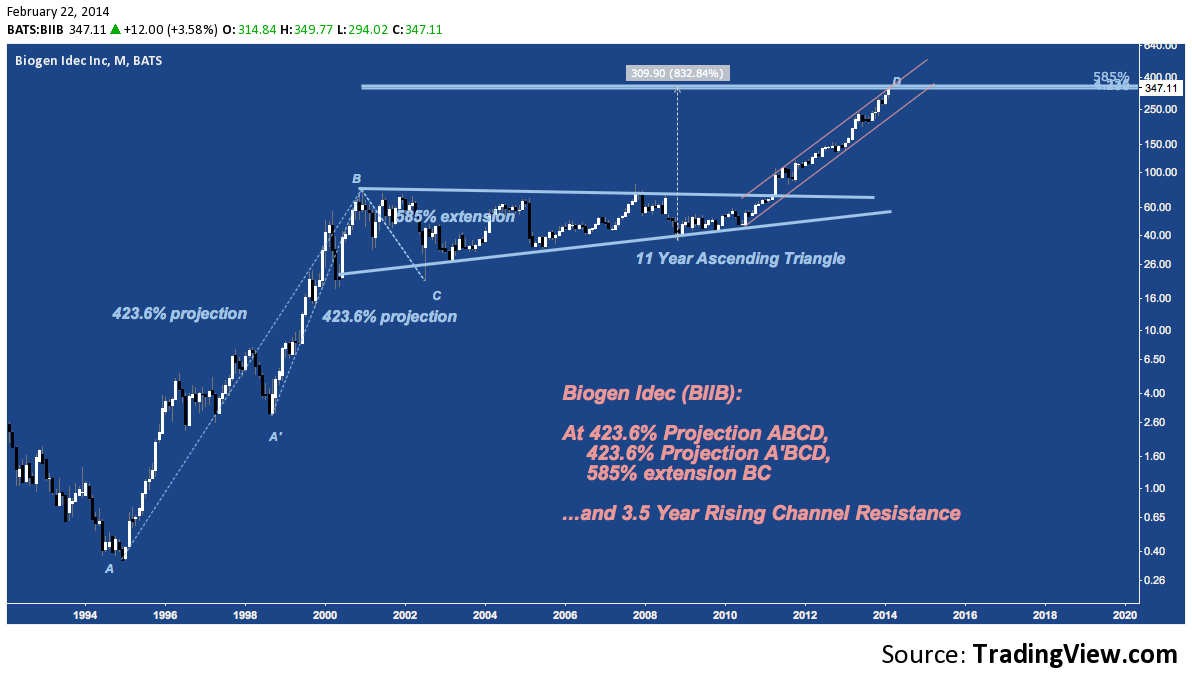
Looking closer, here are the top 5 components of IBB by weight, comprising 36% of the index. Each one of these stocks was a winning lottery ticket: a penny stock that is now at the absolute height of its colossal success, sitting on or negligibly off (get your head in the game, Celgene) all-time highs. Their charts below aren’t about picking out setups – though they’re all tangling with major cluster resistance – but to give a feel for how far Biotech has come, how radically it is outperforming the broader market and why chatter of a Biotech bubble really isn’t so far-fetched.
Biogen (BIIB) – 7.74% by weight
That’s right, +833% since late 2008. Impressive; but hardly uncommon.
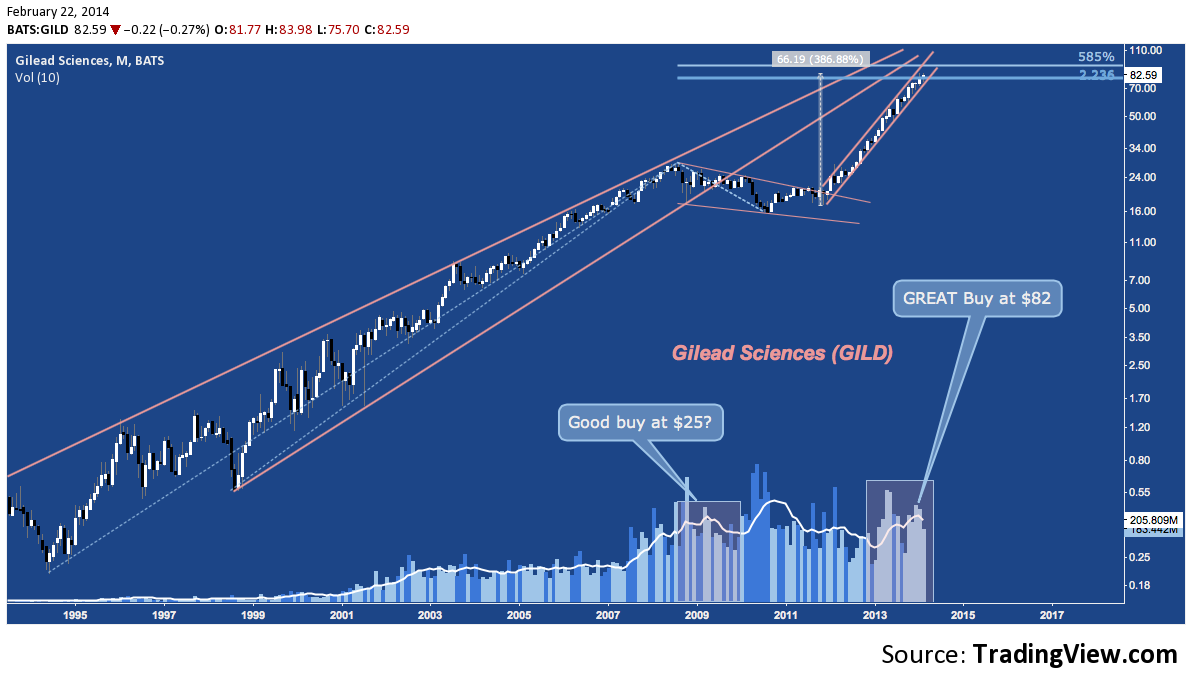
Gilead Sciences (GILD) – 7.44% by weight
One of the most pristine rising channels on any chart anywhere at any time, GILD epitomizes the earlier observation about IBB volume. Expensive at $25 in 2010, the shares are apparently a comparative steal at $82 today.
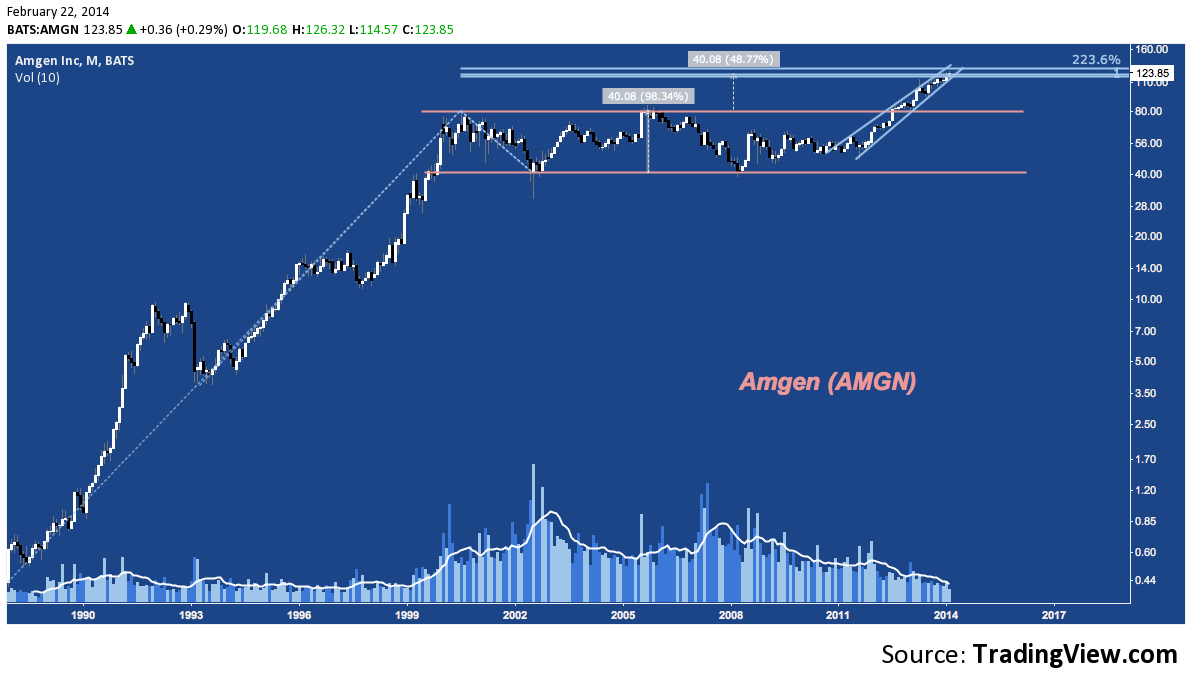
Amgen (AMGN) – 7.27% by weight
Every index has its components that it hopes will just stay upstairs in its room listening to Depeche Mode throughout the entire pool party, and Amgen is among those pariah. Up a comparatively paltry +49% since 2013 began, AMGN just hit the measured move target of the 13-year base it emerged from in Q4 2012. This milestone coincides with major cluster resistance and – in a departure from its peers – comes on volume at 15-year lows.
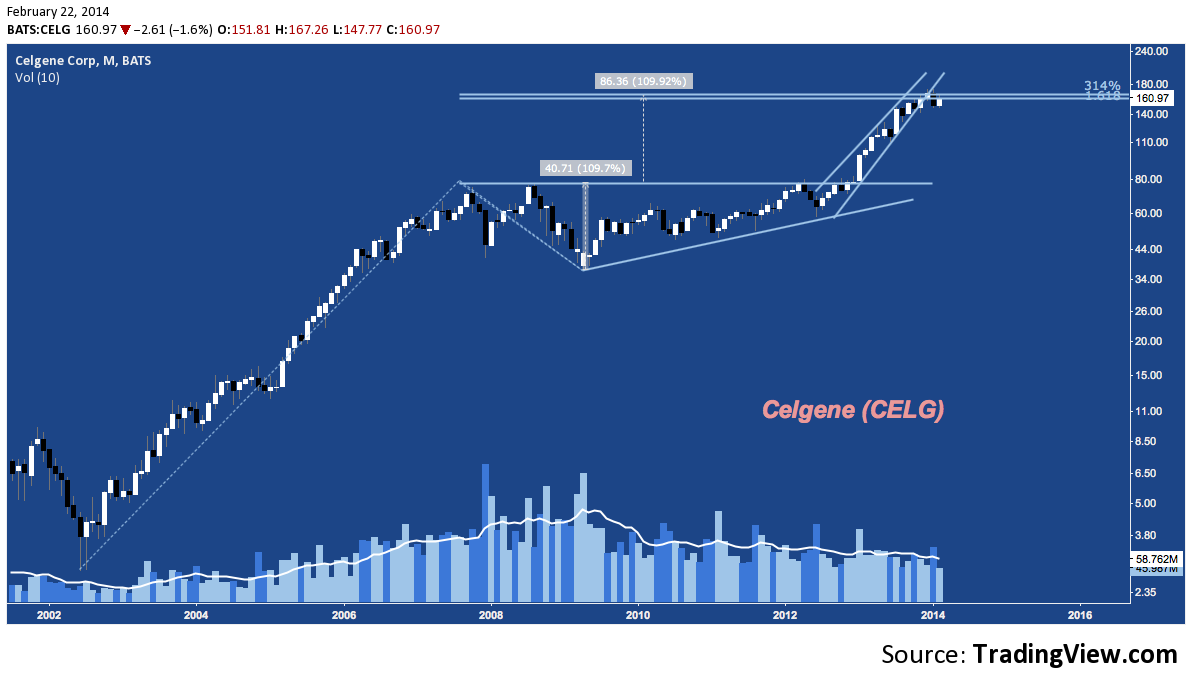
Celgene (CELG) – 6.79% by weight
Like AMGN, Celgene emerged from a multi-year base in late 2012 and has since duplicated the base range, rising over 110% in 12.5 months – right into cluster resistance around which it has moved sideways since late October. CELG‘s interest at this heightened share price hasn’t caved quite like AMGN‘s, but it’s volume has returned to the 2007 levels pre-dating its base.
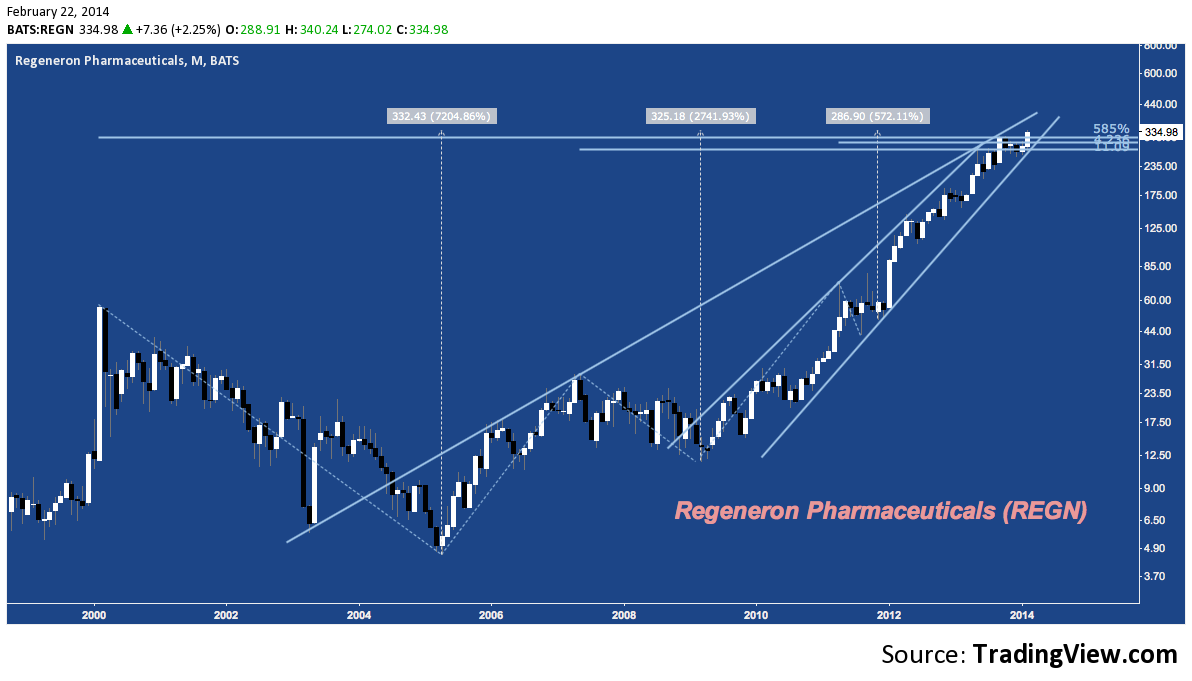
Regeneron (REGR) – 6.71% by weight
REGR rose about 95% last year: a great performance, but let’s be candid: it’s not on pace with the overall 572% return since the broader market’s Q4 2011 bottom. Despite its faded glory, the stock tagged intraday and closing all-time highs Friday, pushing above the congestion at cluster resistance through which it’s been trudging since late September.
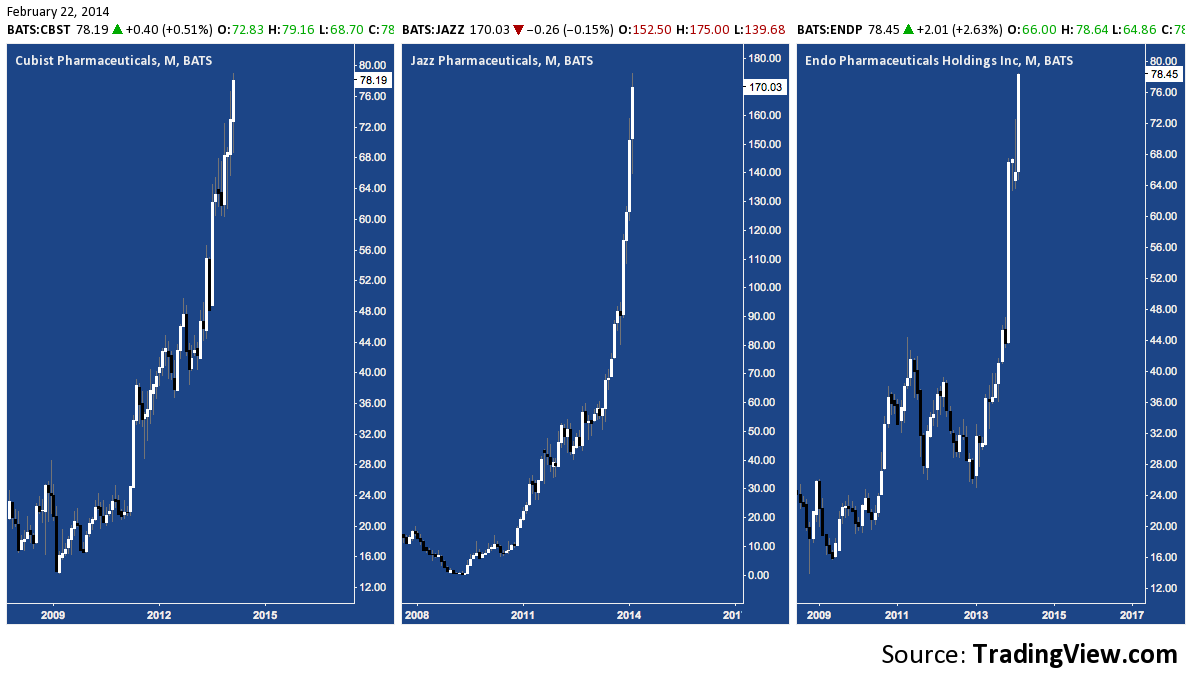
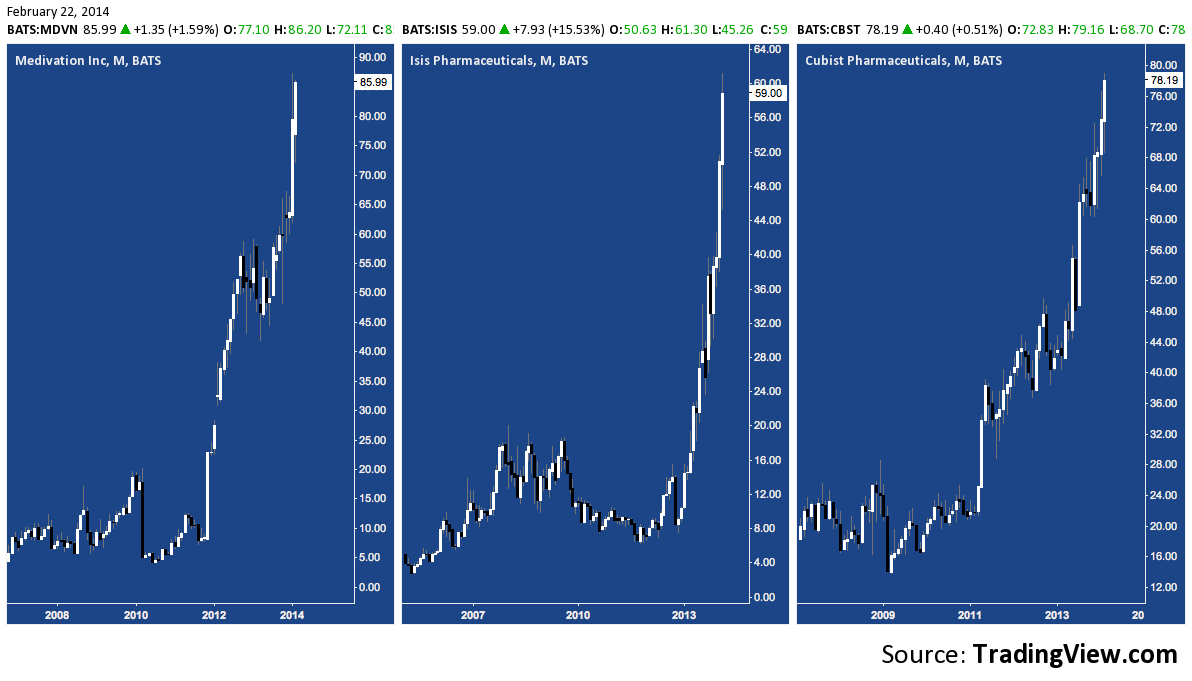
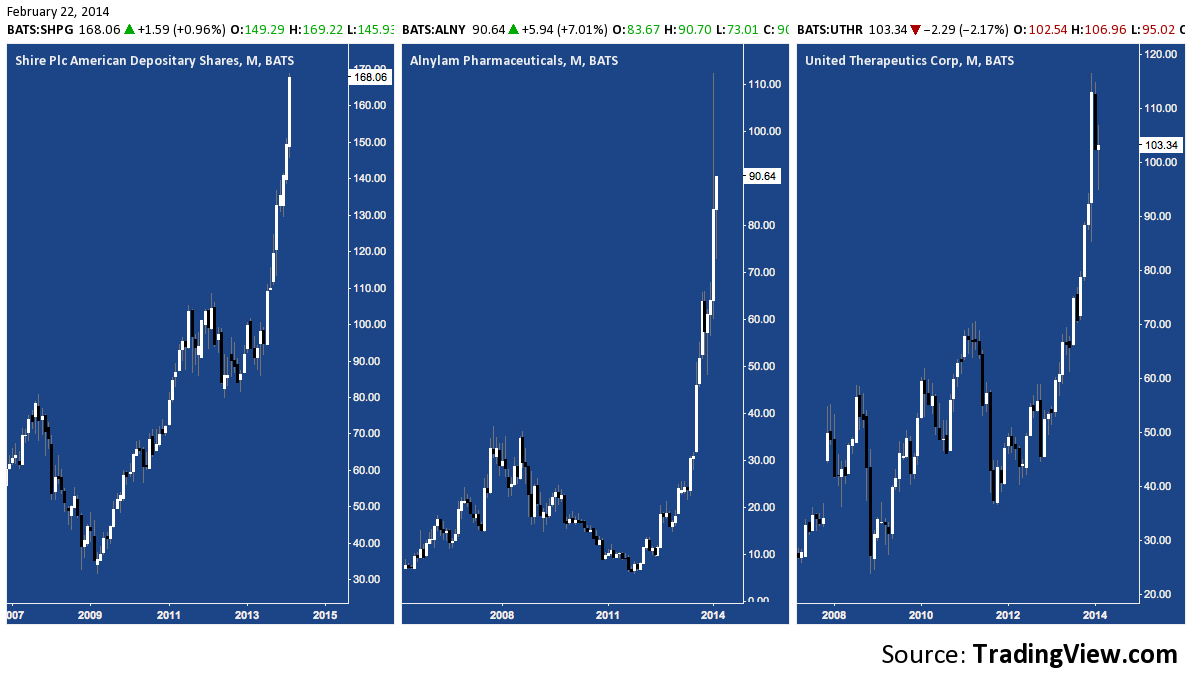
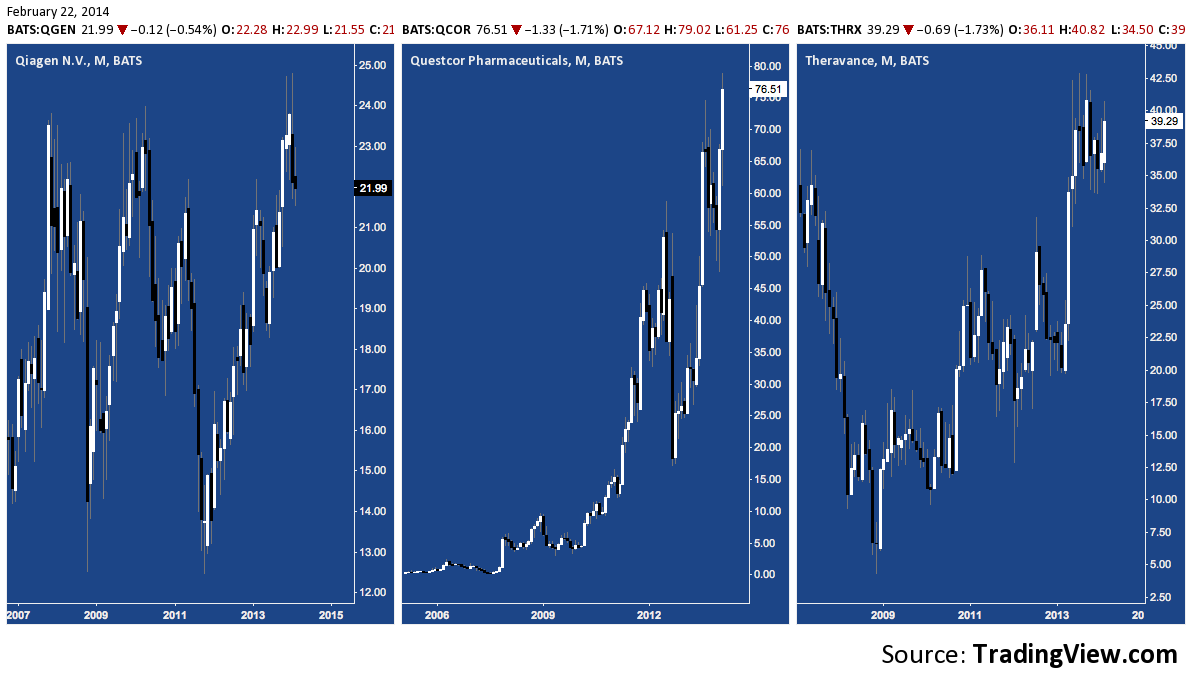
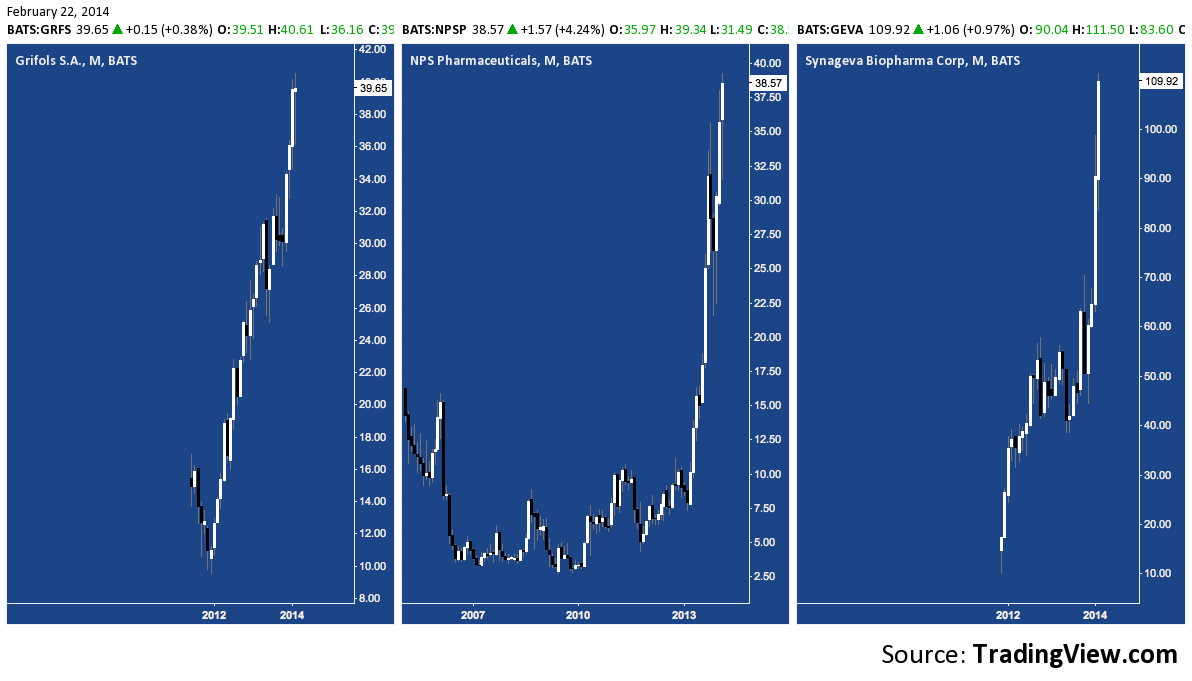
Here are a few more from IBB‘s top 10: the returns since the 2009 bottom (and the 2013 open) are impressive. 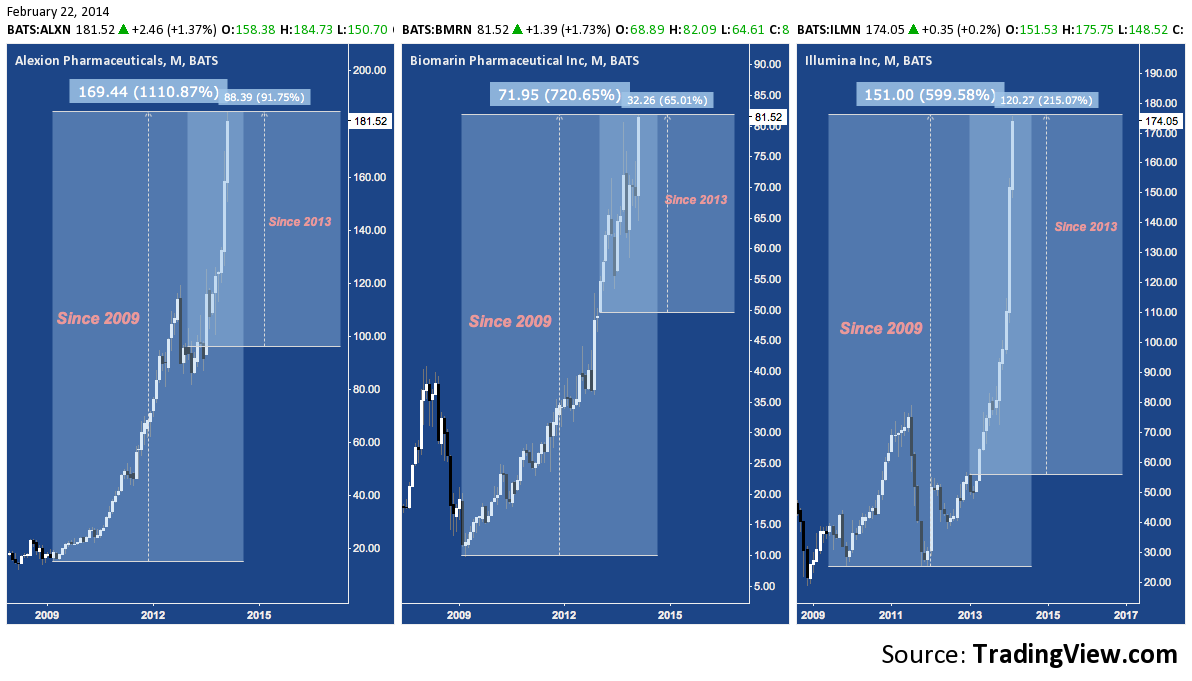
The challenge and (ominous) commentary of these charts that dares to suggest a Biotech bubble is mounting is reverse scarcity: phrases like “hidden gems”, “diamonds in the rough” and “needle in the haystack” are useless here because charts featuring high triple and even quadruple digit gains over the last few years are everywhere – it’s the dross that is hidden away (like Mugatu, realizing this may make you feel like you’re taking crazy pills). The phrase “rising tide lifts all boats” is both apt, and hilariously inadequate.
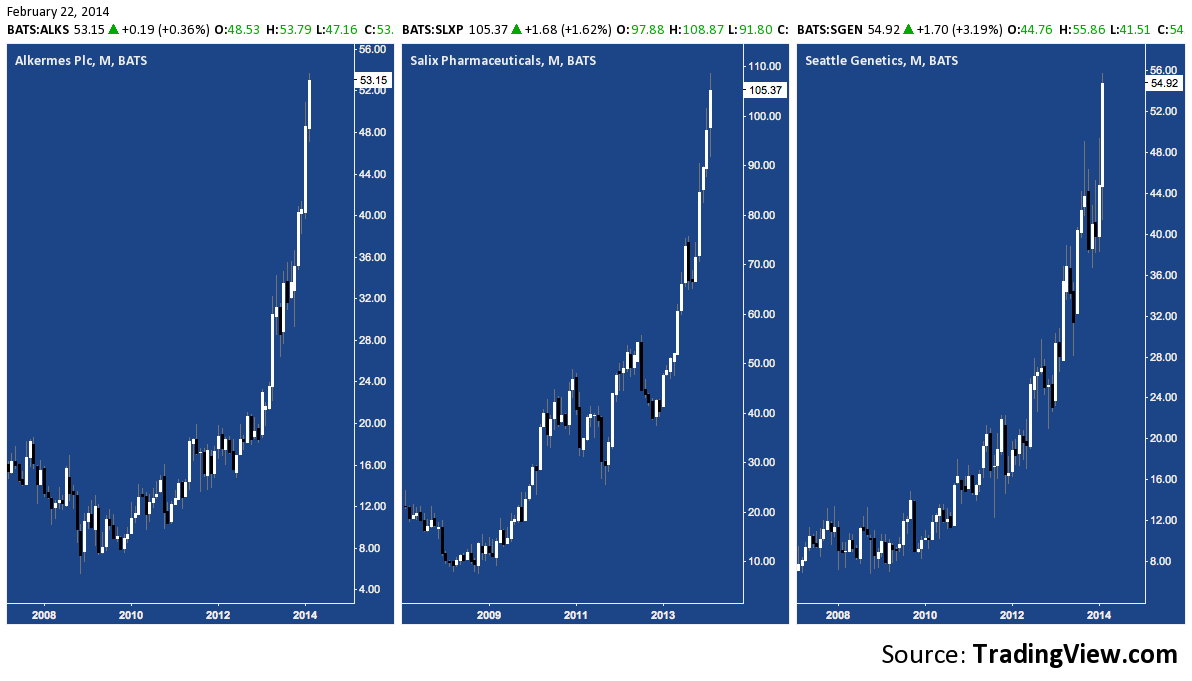
If that sounds incredible, here are the next 21 names in IBB by market weight: with the above, these comprise over 75% of IBB. You’ll never look at the gains of the S&P 500, Russell 2000 or NASDAQ 100 over the last 5 years as anything but pedestrian ever again.
And yes: these are all different stocks.
Happy sledding.
Twitter: @andrewunknown and @seeitmarket
Author holds no exposure to instruments mentioned at the time of publication. Commentary provided is for educational purposes only and in no way constitutes trading or investment advice.
“Welcome to Rapture” Bioshock image copyright Irrational Games or 2K Games
Any opinions expressed herein are solely those of the author, and do not in any way represent the views or opinions of any other person or entity.

