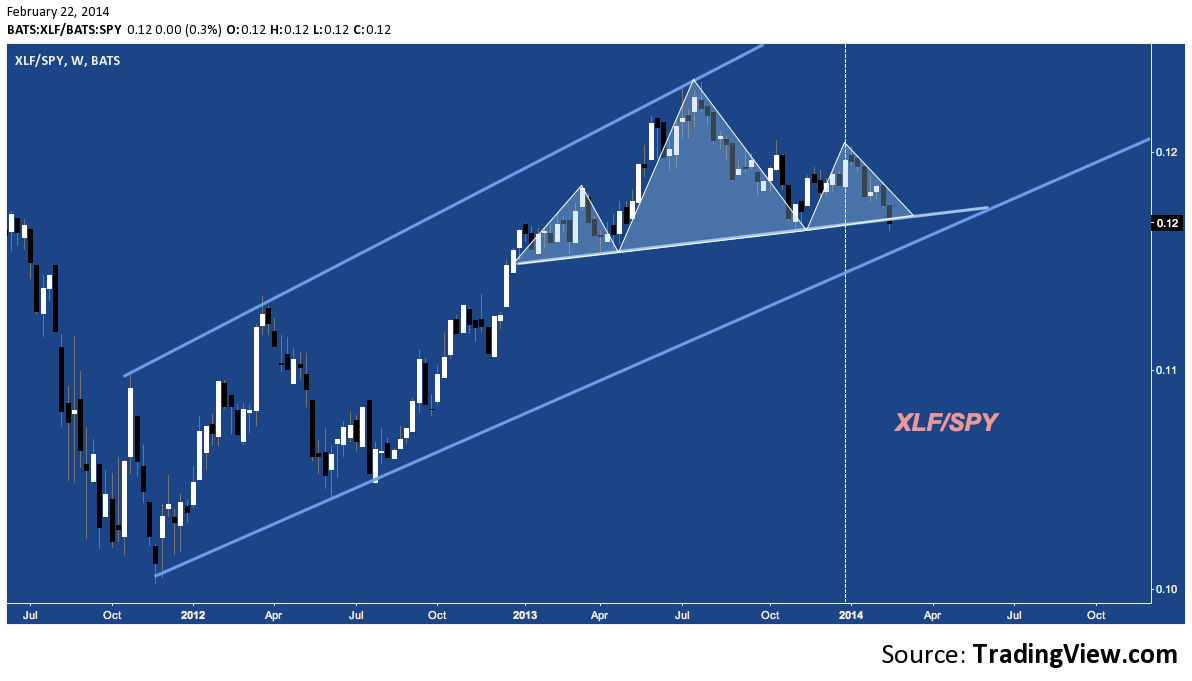
 While the S&P 500 (SPY) has taken back almost 90% of the losses incurred in January’s pullback, Financials (XLF) ended Friday having traversed barely 50% of the way back, just off their November lows versus the benchmark index.
As a rule, classic pattern analysis on ratios is ambiguous at best, but it’s worth noting XLF/SPY broke down through the neckline of a Head & Shoulders Top-like pattern late last week. Could this be a sign of further underperformance for the too big to fail banks stocks (and financials in general)?:
A few weeks ago I did a top-down long-term overview of the largest banks (i.e. too big to fail banks). It was at the bottom of the latest market pullback, and in light of the overarching XLF/SPY ratio above, not surprisingly there were few constructive observations to offer. And now, though the broader market has almost recaptured its early January all-time highs, the outlook for big banks (the TBTFs) has hardly budged.
To capture what’s going on with this relationship, let’s take a wide lens look at the most important component of the Financials sector: here’s the KBW Bank Index (BKX), the marquee 24-issue benchmark comprised of large US money-center and regional banks:
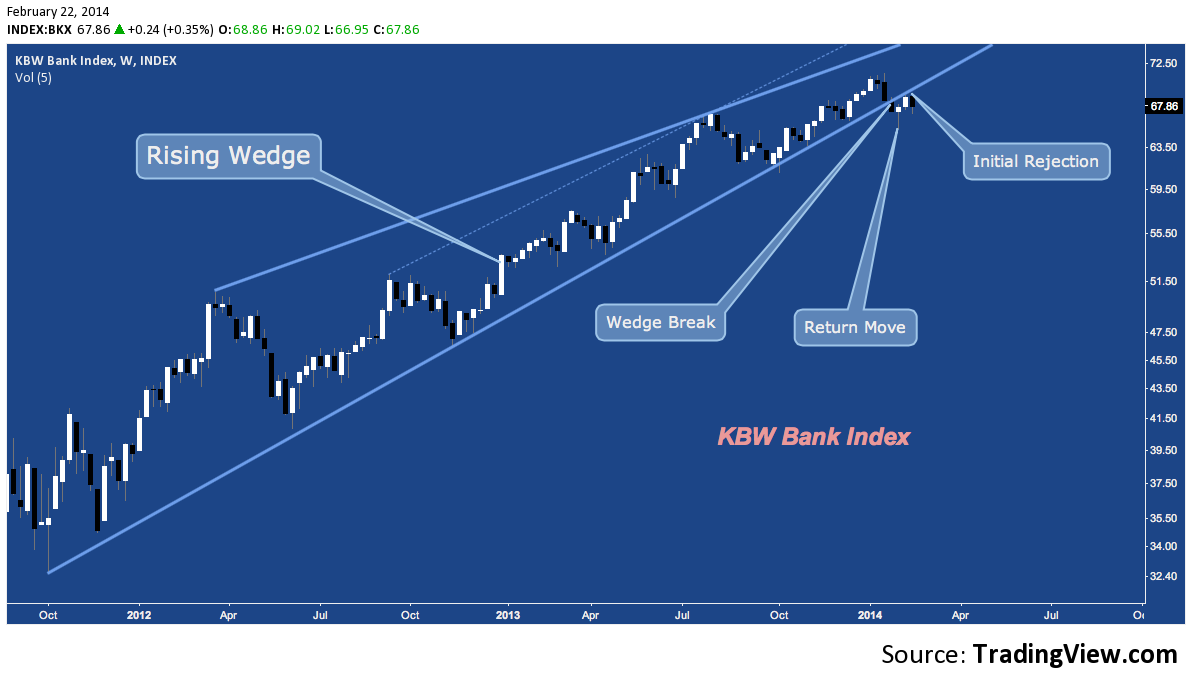
February 4th’s deep dive provides the technical rationale for why January’s rejection near $70 occurred. Now BKX is attempting to recover the rising wedge support it lost 4 weeks ago from beneath; but last week’s rejection hardly looks constructive.
Let’s turn to five of the too big to fail bank stocks featured in early February’s post – the five that are considered altogether representative of US banking (and 4 of which are the top weighted components of BKX):
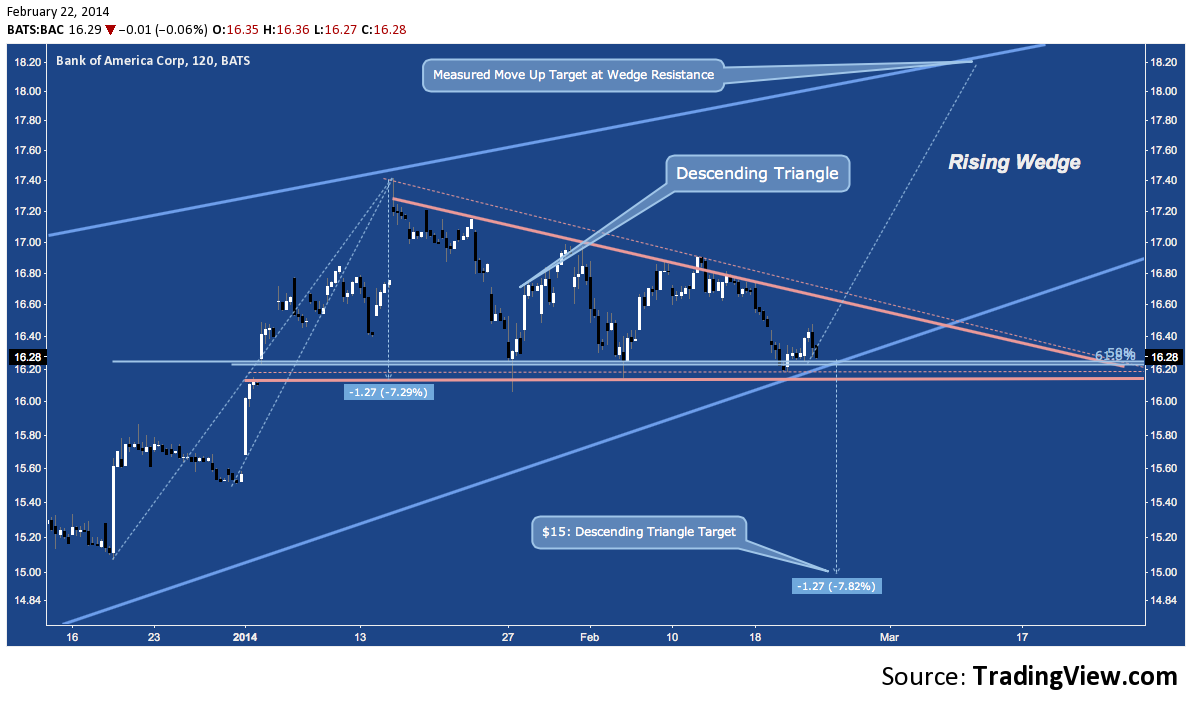
Bank of America (BAC)
As covered earlier, there’s a massive 5 year rising wedge here (the outline of which appears below) and multi-year fibonacci cluster resistance that runs right through the descending triangle that has formed on BAC in 2014. This pattern will break higher toward $18; or it will snap the rising wedge with $15 as an initial target.
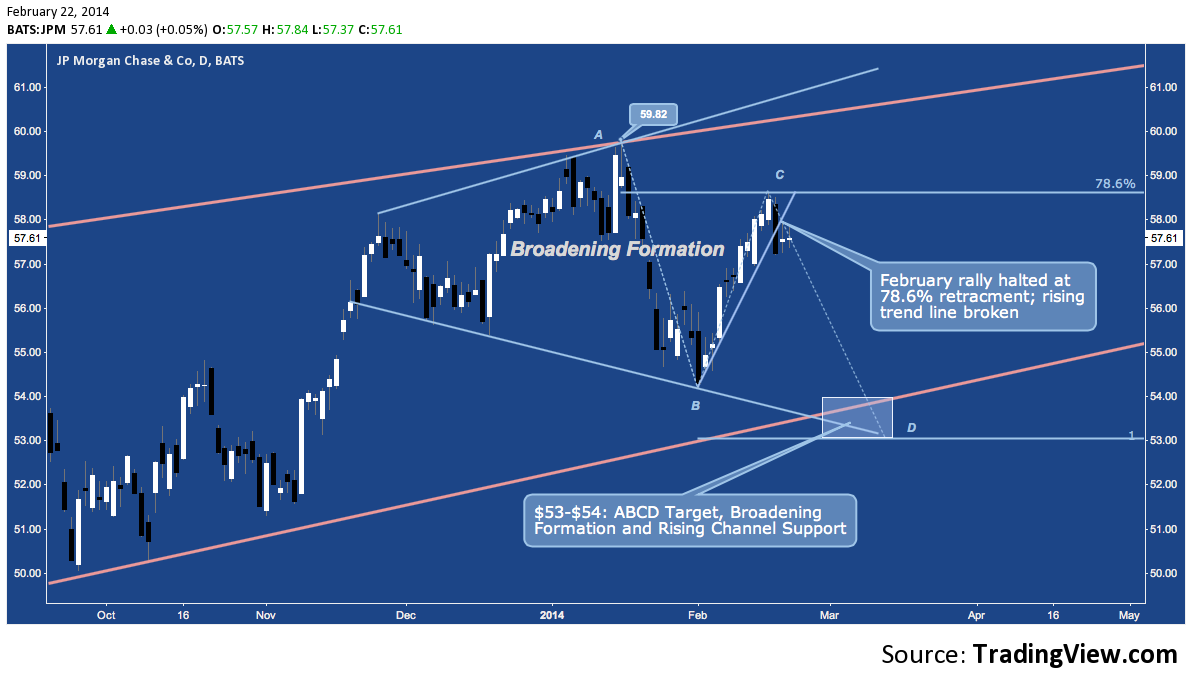
JP Morgan Chase (JPM):
JPM is effectively unchanged since Thanksgiving 2013, meandering sideways in a Broadening Formation over the last three months. Faring better than most of its peers, the House of Morgan retraced 78.6% of January’s losses; but a rising trend line break and lack of a reflexive upside response last week points lower toward a major short-term confluence at D:
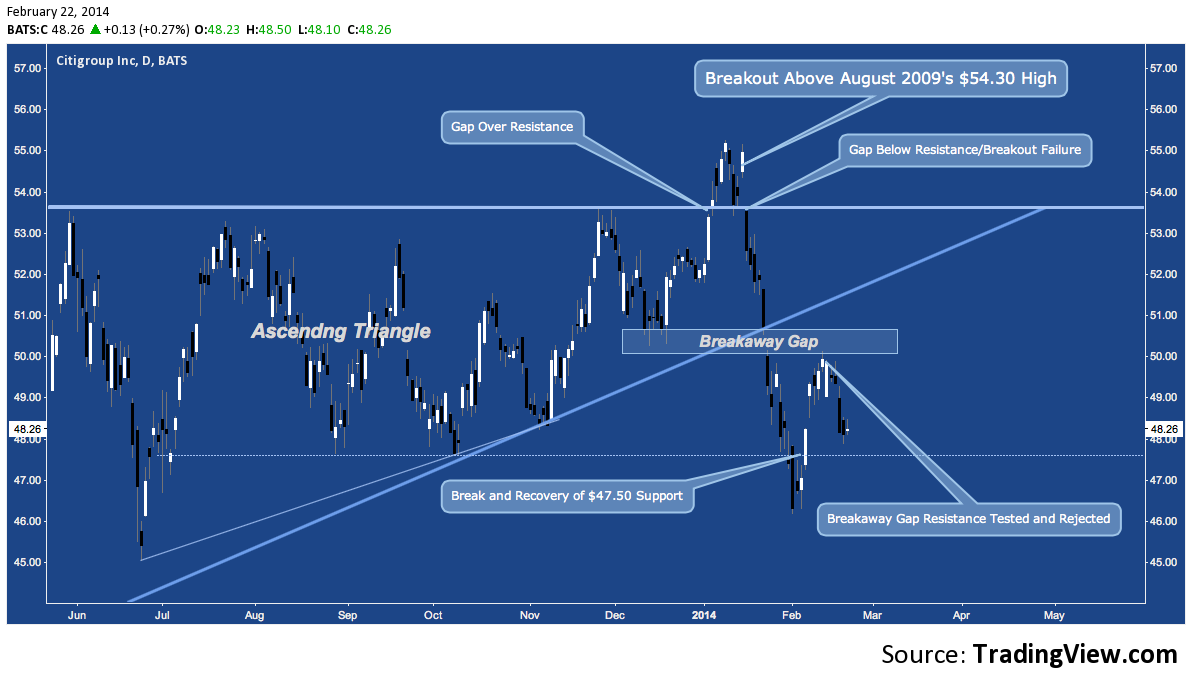
Citigroup (C):
Citi was the spectacular success among its peers during 2013’s Santa Claus Rally; and has been the most spectacular disappointment ever since. Aspiring techniciansshould take note: C‘s January performance is a clinic in textbook classic pattern failure, complete with 1) a gap-up breakout over multi-year resistance, 2) immediate sideways congsetion, 3) a gap-down below multi-year resistance and a hard fade through 2013’s ascending triangle, culminating with 4) a breakaway gap below pattern support. Last week saw a key rejection at that gap level:
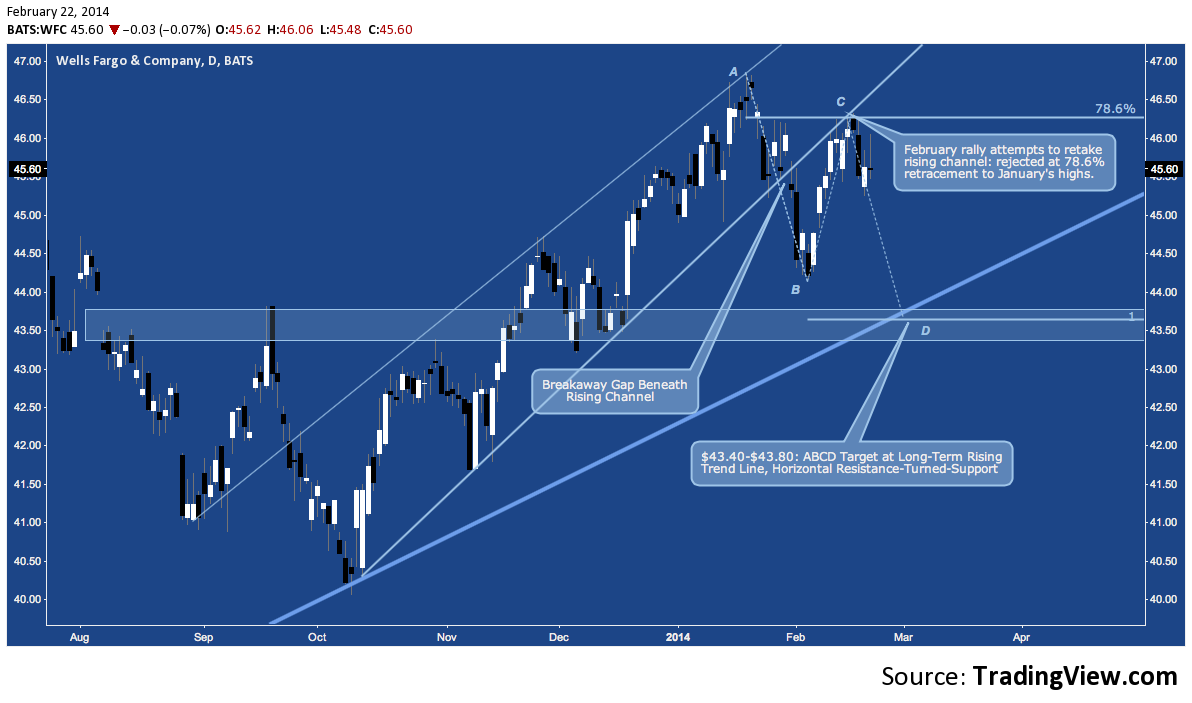
Wells Fargo (WFC):
Like JPM, Wells retraced 78.6% of January’s pullback, here touching late 2013’s rising channel support-turned-resistance before fading last week. This broaches the discussion of an ABCD target almost 5% lower:
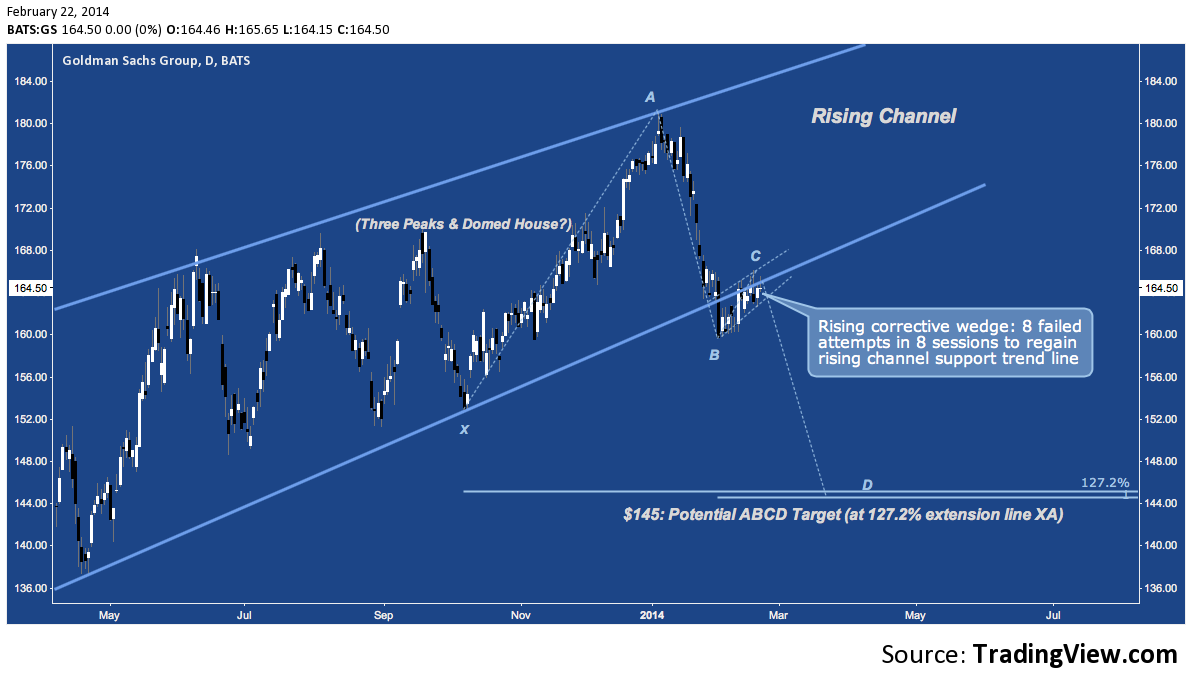
Goldman Sachs (GS):
Like the others, Goldman is facing off against a huge technical barrier that has been setting up throughout the 2009-2014 cyclical bull (check out the 5-year Bearish Bat harmonic pattern that pegged resistance at 180 at the bottom of early February’s piece). Staggeringly, GS has somehow managed to do even less than Citi to recover January’s correction, pulling ahead in the prestigious TBTF race to the bottom. What it has accomplished (yes, there’s something), is a modest wedge – a bear pennant, really – that has tried and failed in 8 consecutive sessions to recover 2013’s rising channel. And – since it’s fashionable to note this on the Dow Industrials (DJIA) right now – is that a Three Peaks and Domed House?
Twitter: @andrewunknown and @seeitmarket
Author holds no exposure to instruments mentioned at the time of publication. Commentary provided is for educational purposes only and in no way constitutes trading or investment advice.
Any opinions expressed herein are solely those of the author, and do not in any way represent the views or opinions of any other person or entity.


