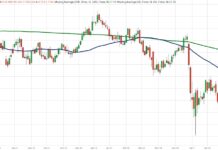
Would Crude Oil Price Breakout Surprise the Bears?
WTI oil prices are currently facing a complex interplay of factors.
While OPEC+ production increases are likely to put downward pressure on prices, supply disruptions,...
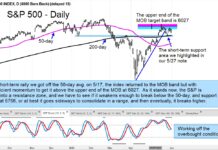
S&P 500 Index Reaches Upper Price Resistance Band
The S&P 500 Index has rallied sharply off the April low.
That said, it has reached an important short-term price resistance area at its MOB...
Biotechnology Sector ETF (IBB) Nears Important Pivot Point
As of the latest data available, the top three holdings in the iShares Biotechnology ETF (NASDAQ: IBB) are:
Gilead Sciences, Inc. (GILD)
Amgen Inc. (AMGN)
Vertex Pharmaceuticals...
Retail Sector (XRT) Vying For Stock Market Leadership Role
While the tech sector tries to lead, you can clearly see the Semiconductors (SMH) trying hard to hold onto its 50-week moving average... and...

Uranium ETF (URA): Potential Bullish Squeeze Setup
The past two months have seen the Uranium Sector ETF (URA) rocket higher by 60%.
Momentum is building for nuclear and alternative power sources.
Could the...
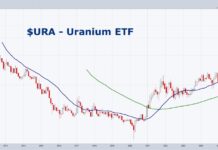
Uranium ETF (URA) Current Price Analysis and Future Considerations
I am back from a 3 week break, but before I took off, I bought the Uranium ETF (NYSEARCA: URA) at $20.
This has been...
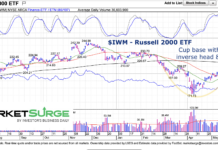
Is Russell 2000 Building Bullish Base?
It's been some time since the Russell 2000 has been an out-performer.
And, although we propose a potential bullish pattern on the small cap Russell...

Three Charts Say Gold Still Glistens
Investors who have been following the long-term uptrend in gold have begun to question the sustainability of the bullish phase. Here are three charts that...
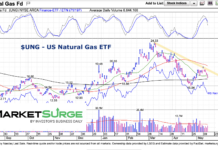
Natural Gas ETF (UNG) Trying To Fend Off Nasty Pullback
Things were looking up for natural gas at the beginning of the year.
But a big rally gave way to a big selloff.
Today, we look...
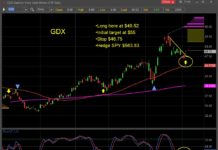
Gold Rally Triggers Trading Buy Signal In Miners
Precious metals continue to trade with the wind at their back.
Gold has rallied back to around $3400 per ounce and this is fueling yet...