
Stock Market Correction and July 6-Month Calendar Range
On July 13th I wrote a market update on how the July 6-month Calendar Range Resets.
To refresh your memory.
The July Stock Market PatternThe Six-Month Calendar...

Vanity Stocks: Apparel Adapting to Shifting Body Sizes
As GLP‑1 weight-loss drug adoption grows 12–15% of U.S. adults are currently or planning to use them—food, wellness and fashion brands are pivoting to address...
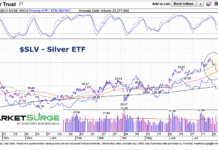
Silver Price Correction Over? Or Just Beginning?
Silver has been red-hot this year, nearly hitting $40 recently.
But price action doesn't move in a straight line. Silver has pulled back over the...
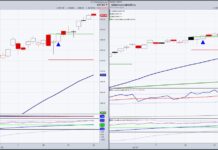
Why the Stock Market Is At Record Highs
The S&P 500 (NYSEARCA: SPY) and Nasdaq 100 (NASDAQ: QQQ) continue to drive this market higher.
Note how far above the price is from their...
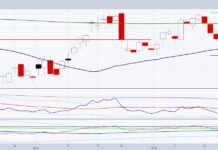
Energy Sector ETF (XLE): Creating Bullish Divergence?
Here are the top 10 holdings of the S&P Energy Sector ETF (NYSEARCA: XLE) as of July 24, 2025, along with their respective weightings:
Data according...
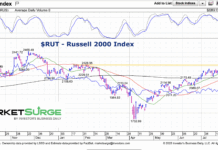
Russell 2000 Index Looking Up At Resistance
It's been a nice comeback story for the stock market.
Early in the year, stocks were down and uncertainty high. But from there the 'wall...

How Low Can Natural Gas Prices Go?
I did this research using AI when I asked the question:
Can natural gas producers afford to extract gas if price is below 4?
Whether natural...

Russell 2000 (IWM) and Semiconductors (SMH): Concerning Price Pattern?
After an epic week where only a few sectors plus the S&P 500 and NASDAQ shone, it turns out that it’s the calendar price...

Oil Prices Trading In Important Price Range
Now that the stock market calendar range for July is set, let’s look at crude oil futures.
First, there is the chart of the United...

10-Year US Treasury Bond Yield Trading At Important Resistance
All the talk is about interest rates.
Political pressure on the Fed to lower interest rates is nearing a crescendo. It's annoying. But in every...