Can Major Stock Market Indices Hold 50-Day Moving Average?
After the quarter-percent rate increase, the market continues to rally off recent lows.
Now all the major indices besides the Nasdaq 100 (QQQ) have cleared...
Is Gold Miners ETF (GDX) Headed Back Up Over $40?
At the beginning of March, we shared a buy setup for the Gold Miners ETF (GDX) and that trade worked out quite well.
Today, we...
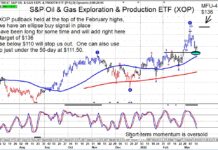
Crude Oil and Energy Stocks, ETF (XOP) Heading Higher
We are not expecting crude oil or energy stocks to rally in a straight line up, but we are off to a good start.
The charts...
Is Amazon Stock Price Repeating 2018 Bottoming Pattern?
The decline in Amazon's stock price over the past several months has been an important event for investors.
Let's face it, Amazon (AMZN) is one...
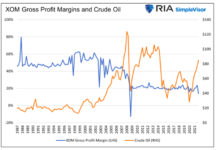
Big Oil and The Fallacy of a Windfall Profits Tax
Higher energy prices worrying you? Be afraid because Congress is coming to the rescue. Legislators are introducing a new bill called the “Big Oil...
Rates Increase and Transportation (IYT) Clears its Major Moving Averages
Wednesday, the market rallied into the Feds rate announcement, showing speculator's optimism given the current downward trend.
It also helped that Monday, the Nasdaq 100...
Elliott Wave Says GOLD and Silver Have Room For Deeper Correction
The US Dollar is trading at elevated levels, even accelerating as Gold and Crude Oil trade lower (which is positive for the USD).
A stronger...
Stock Market Outlook Brightens As Indices Try To Reverse Higher
The S&P 500 Index rallied strongly and finished higher by 2.14% on Tuesday. 88 percent of its components finished higher with only Energy stocks...
Are Chinese Stocks About To Head Lower?!?
The Chinese stock market has struggled mightily over the past several weeks and months.
And today's "monthly" chart of the Hang Seng Index highlights this....
Has the Nasdaq 100 (QQQ) Reached its Breaking Point?
The overall trend in the major stock market indices is downward.
Though we’ve had small rallies, our last jump in price was minor and right...


