The decline in Amazon’s stock price over the past several months has been an important event for investors.
Let’s face it, Amazon (AMZN) is one of the key large cap tech stocks in the world.
So Amazon’s (AMZN) stock price performance should garner all of our attention. But there are some additional possibilities to open our minds to… one being that Amazon is finding a bottom right now.
There are many different ways to identify potential bottoming patterns but for this exercise, I’ll simply look at recent history and compare a past bottom to recent price action.
Note that the following MarketSmith charts are built with Investors Business Daily’s product suite.
I am an Investors Business Daily (IBD) partner and promote the use of their products. The entire platform offers a good mix of analysts, education, and technical and fundamental data.
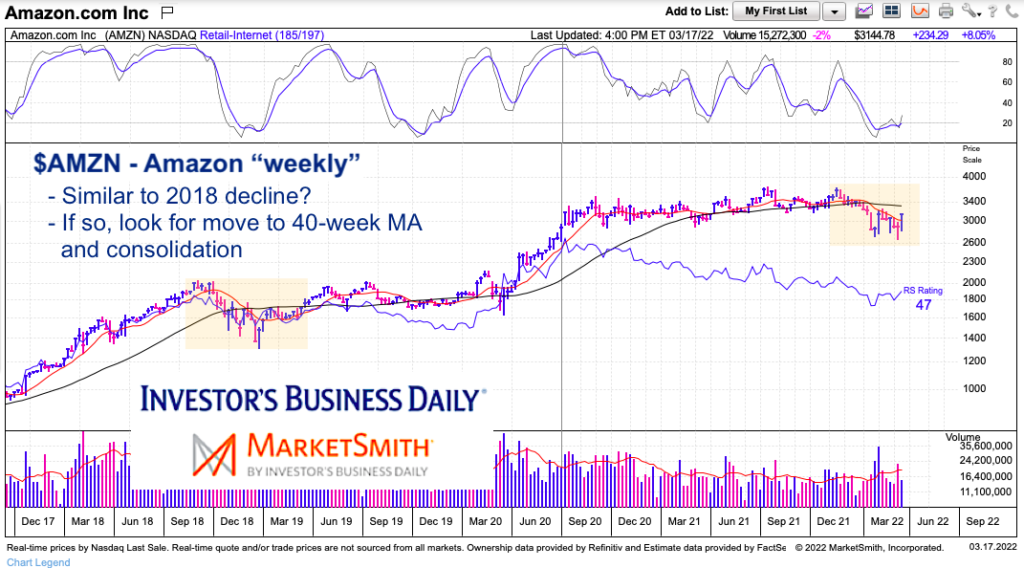
$AMZN Amazon “weekly” Stock Price Chart
To keep it simple, I highlighted the recent period of price action along with our comparison price action in 2018 (orange shade).
As you can see, the 10-week moving average crossed below the 40-week moving average during the downtrend. Around the same time, momentum bottomed and began moving higher as price bottomed. Then a rally broke back above the 10-week moving average.
If this is a similar bottoming pattern, then I would suspect price will consolidate around the 40-week moving average for several weeks before moving higher.
Twitter: @andrewnyquist
The author has a trading position in mentioned securities or similar at the time of publication. Any opinions expressed herein are solely those of the author, and do not in any way represent the views or opinions of any other person or entity.

: Showing Some Signs of Emerging Strength")

