Weekend Market Outlook (August 25): Stocks Make New Highs!
Another week gone by and there is a lot of market news and price action to discuss.
In this week’s weekend market outlook we will...
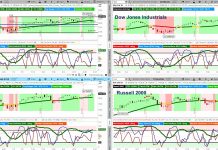
U.S. Equities Weekly Outlook: Stocks Looking For Breadth Surge
Key Takeaways:
The S&P 500 (INDEXCBOE:.INX) has not been able to follow other indexes to new highs as momentum and stock market breadth have failed...
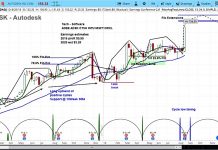
Autodesk Stock Breaks Out, Market Cycles Point Higher Yet
Autodesk stock (NASDAQ: ADSK) traded 15% higher on Friday morning, after posting earnings that beat analyst estimates.
The software maker reported earnings per share of...
When is it Safe to Buy Gold?
The following article is a part of my Gone Fishing Newsletter that I provide to fishing club members each week to identify macro inflection points and...
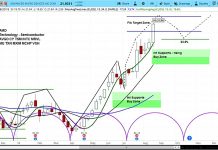
AMD Price Target Upped, but Cycles Point to a Pullback
Advanced Micro Devices (NASDAQ: AMD) traded nearly 5% higher on Thursday morning, after a stock analyst raised its target.
Rosenblatt Securities raised its price...
S&P 500 Trading Outlook: Bulls Losing Grip On The Advance
U.S. Stock Market Bottom line: Equities have snapped back intraday, reclaiming about 75% of what was lost since yesterday.
But breadth is flat and the...
Target Stock Rallies On Earnings: Breakout Points Higher Yet
Target (TGT) traded 5% higher on Wednesday morning, after posting earnings that beat analyst estimates.
The company reported earnings per share of $1.47 and total...
Mid-Week Stock Market Outlook: New Highs! …But Tech Lags
Our mid-week market outlook video has got you covered with lots of market insights and interesting trade setups. Notably, the S&P 500 and Russell...
U.S. Stock Market Breakout Simmering… But Not Yet
What?!? How can this be? The stock market rocketed higher the past 5 days... how can you not be bullish, you ask?
To be honest,...
Fibonacci Extension Extravaganza: U.S. Stock Indices Facing Big Tests!
In my 38-years I haven't seen so many stock market indices testing Fibonacci extension levels at the same time.
S&P 500 (SPX), Dow Jones Industrials...


