The following article is a part of my Gone Fishing Newsletter that I provide to fishing club members each week to identify macro inflection points and actionable micro trade set-ups.
I have written about this subject before for SeeItMarket and my clients.
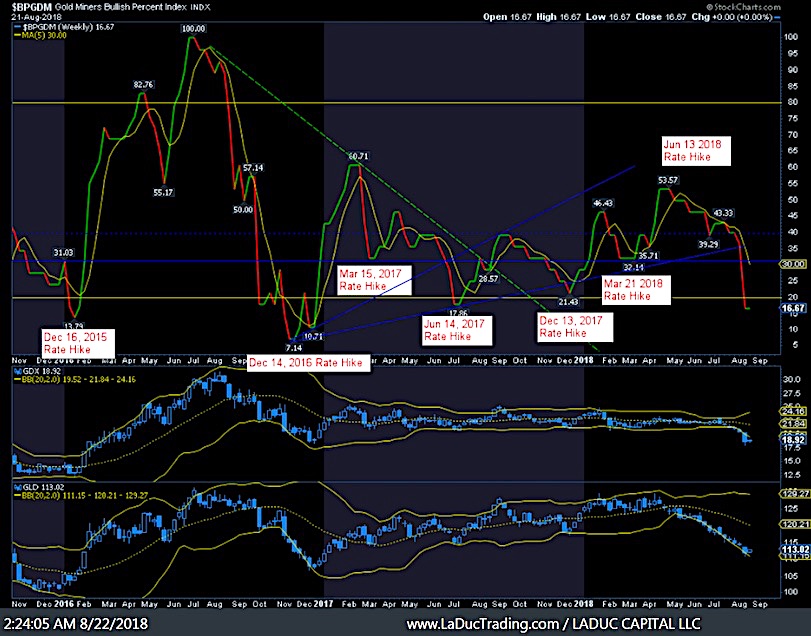
I have been a firm believer that Gold (NYSEARCA: GLD) and Gold Miners (NYSEARCA: GDX) trade down into a Fed Meeting Rate Hike.
Why do I believe this?
Because with each rate increase since December 2015, Gold has caught a bid – except the last one in June of this year, and that is because (as discussed in prior Gone Fishing Newsletters) China has been devaluing its Yuan to compensate for Trump’s Trade Tariffs (causing the USD to rise, making Gold less attractive as an investment over dollars).
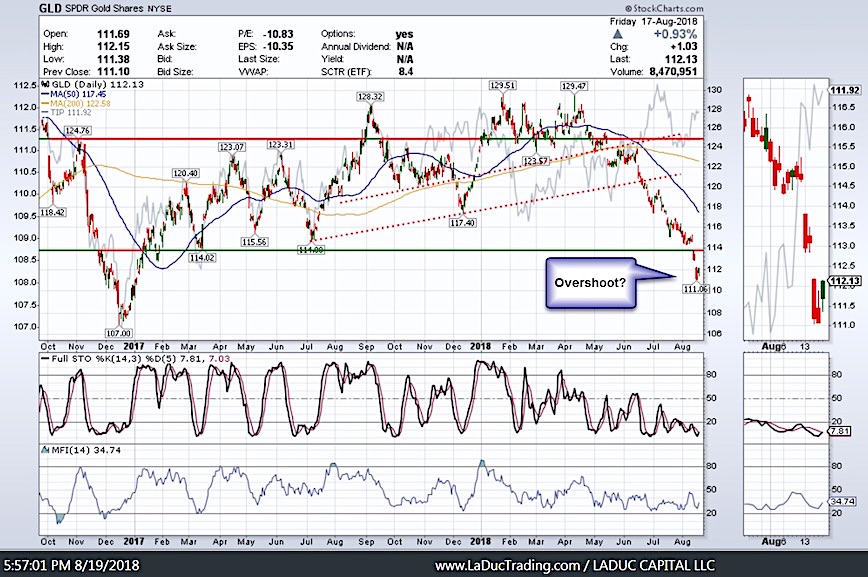
So now that my favorite indicator is flashing EXTREMELY OVERBOUGHT, is it time to buy Gold and Miners?
Well, the September 26th Fed meeting is one month away – plenty of time for Gold to digest and consolidate before moving higher in September/October. And although many are calling for Gold to reverse sharply now on USD weakness, the USD may not be entirely ready to retreat. I still feel Gold may frustrate until September 26 at a minimum when the Fed is expected to next raise rates, and longer if China is still devaluing.
But the meat of a Trend Reversal comes after a bottom formation pattern has emerged – like the Inverse Head & Shoulders pattern in Dec 2016. All we have now is an overshoot into extremely oversold territory. In Dec 2016 when this indicator first crossed the yellow line, GLD was ~$120, when it finally bottomed (head of the inverse H&S), GLD was ~$105 (which was also Quarterly support – written about then as well).
With that, I think it would be wise to cover swing shorts and wait for confirmation the ‘event’ of bottoming has occurred before buying with the expectation of a sustainable rally. Of course, there will be lots of trading opportunities on shorter timeframes in the meantime and we will be chasing those in my Live Trading Room.
Ironic
I literally, and unknowingly, called the recent collapse in Gold in my SeeItMarket article May 7th. The irony is I stated June/July as possible bottom but Fed was more dovish in June…they are expected to raise rates this September by a near 100% margin.
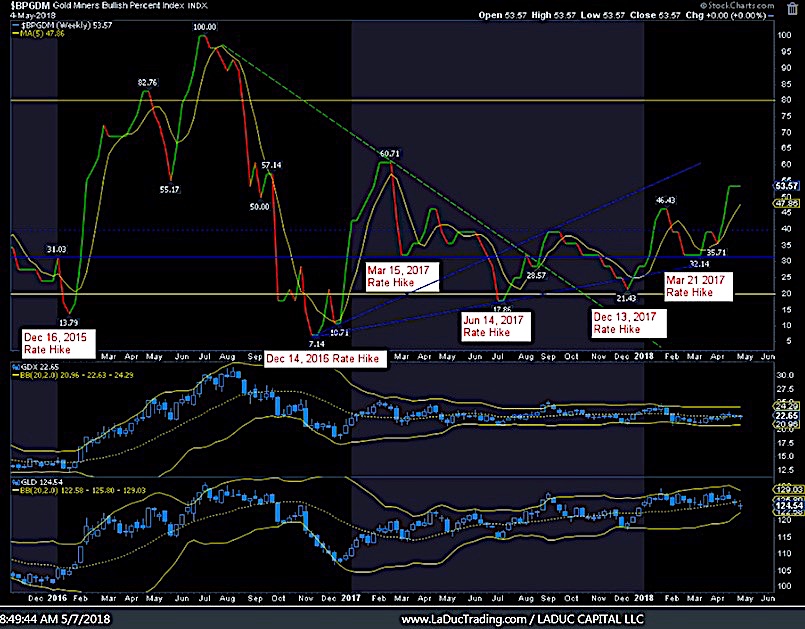
If the Fed succumbs to the pressure of Trump’s tough talk (implying Fed is working against the President), and the Fed doesn’t raise rates (although I’m not expecting that) Gold will be susceptible for lower, potentially much lower for longer. That is a lower probability play however. I think, and have written in 2Q extensively, that markets are most likely to pull back in the Fall and Gold/Miners to rise. We are almost there.
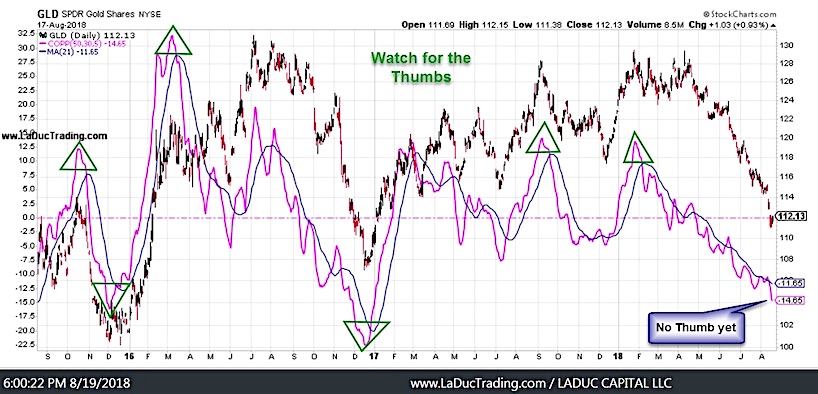
Yes, I look for all kinds of patterns to predict repeatable trade set ups. In the case of GLD, I noticed a type of “Thumb” in this chart using Coppock Curve indicator (Bollinger Band outliers also work). I am waiting for the next one to signal to provide even more confidence in buying Gold for a Turn higher. Almost there.
Thanks for reading and please consider joining me in the LIVE Trading Room where we work through Value and Momentum trade ideas and set ups every trading day.
Twitter: @SamanthaLaDuc
Any opinions expressed herein are solely those of the author, and do not in any way represent the views or opinions of any other person or entity.


