The following article is a part of my Gone Fishing Newsletter that I provide to fishing club members each week to identify macro inflection points and actionable micro trade set-ups.
Gold – big picture – is coming into focus as I see a Major Inflection point coming for Gold (and from which trades for Silver, Palladium and Miners will develop). For now, I wanted to address Gold and the main currencies which affect Gold.
Macro Matters
Yes, the US Dollar and Gold are inversely related, for the most part, which is why I track the Correlation Coefficient. In 2016, it was extremely tight. In 2017, less so, and yet, they still managed to demonstrate the interconnection: The US Dollar dropped 12% in 2017 with Gold (GLD) rising 18% – and this was before the most recent 3.5% oversold bounce in the Dollar ETF (UUP) for last month which saw GLD fall 1.5%. It could have been worse.
Rising US Dollar is bad for Gold, but a rising Yuan is really bad for physical Gold demand, where China is the world’s biggest bar and coin market, and as you know we have Trade War posturing with China, so when talks get heated the Yuan starts rising (safe-haven buying). This may have contributed to first-quarter demand for Gold being the lowest since 2008.
Implicit Gold Message: We need to keep watching the Yuan and those China trade talks too!
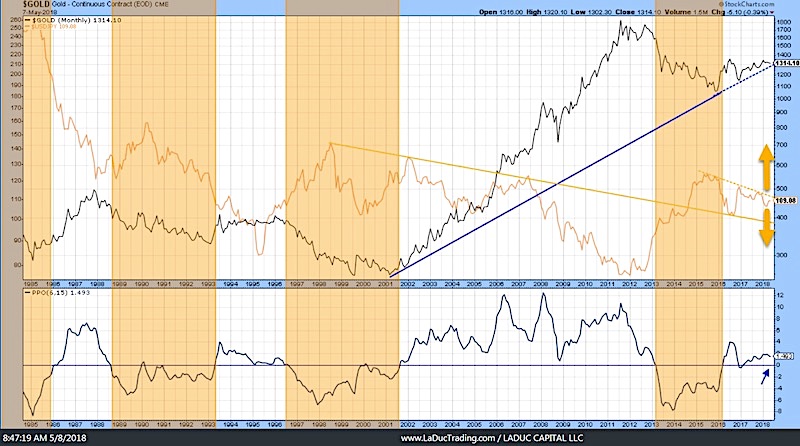
Another metric I like to compare with Gold is the US Dollar (USD) – Yen Carry Trade: USD/JPY pair. The following monthly chart best demonstrates the inflection point of Gold. If USD/JPY breaks out above its current channel, Gold likely travels inversely with it – lower. But if USD/JPY falls to the bottom of it’s trendline channel, or more dramatically breaks this trendline, then Gold will likely explode higher. Note the PPO indicator in the bottom panel bears watching as it slopes downward, which would be very bearish Gold should it break/stay below the 0 mid-line.
Implicit Gold Message: Yen Matters too!
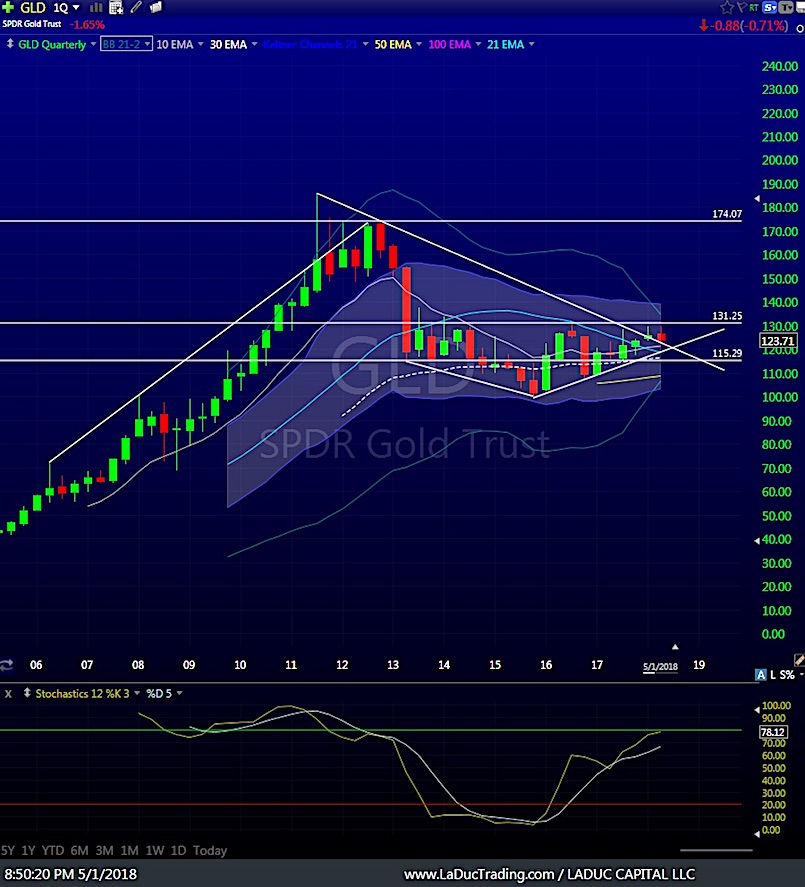
Stepping back, here is a Quarterly chart of the Gold ETF (GLD). Technically speaking, a break above $131 is very bullish – and a break below $115 very bearish. We are right in the middle at ~124 so it’s choppy inside this channel while the world currencies of USD, Euro, Yen and Yuan wrestle with the geo-political backdrop of at least six major international disputes: * Iran nuclear sanctions * North Korea nuclear program * China trade war * EU/Japan steel tariffs * NAFTA re-negotiations * Russia sanctions.
Implicit Gold Message: Political Instability matters too!
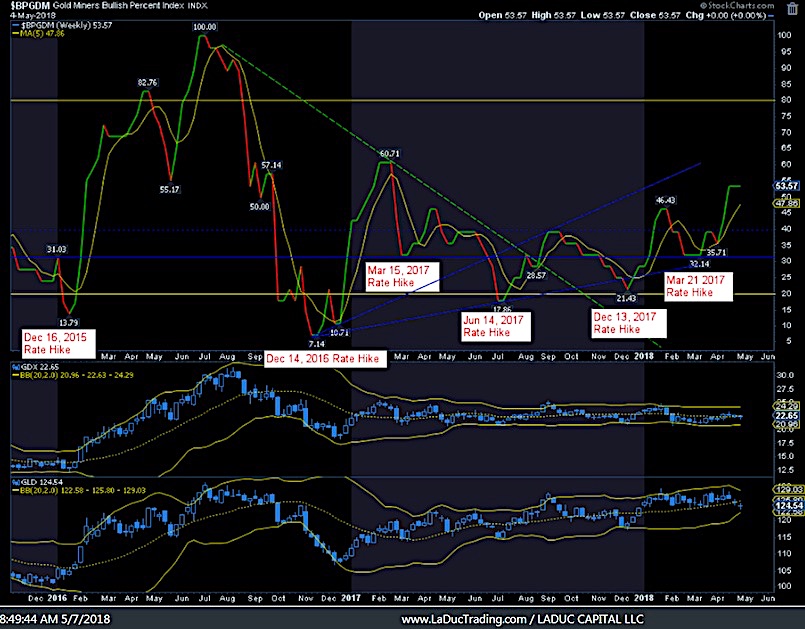
While global trade posturing and positioning takes place, we also have a Fed in the midst of Quantitative Tightening (QT). Although the Fed didn’t raise rates in their May meeting, there is high probability they will in June. With each rate increase since December 2015, Gold has caught a bid. Therefore, I expect GLD to potentially trade down into the $120 area from which it will gather up enough time and energy to move higher – but not until the next Fed meeting in June, maybe not even bottoming until July.
Implicit Gold Message: Interest Rates matter too!
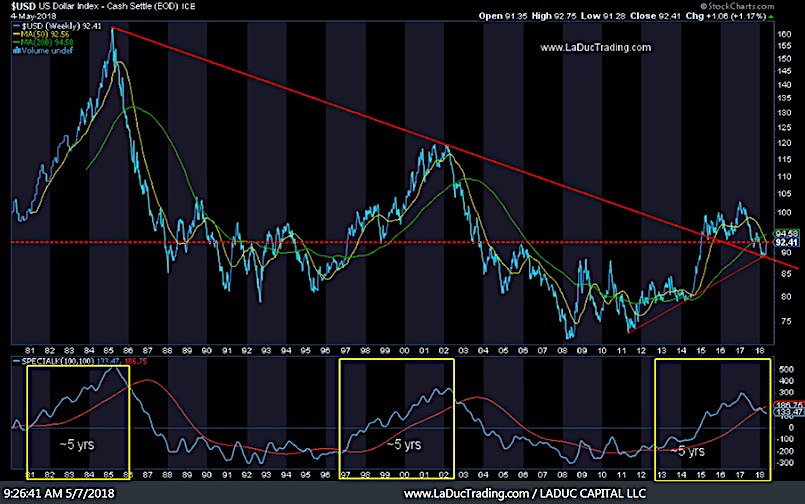
U.S. Inflation (CPI) economic reports this week may put pressure on the USD to pullback (and Gold/Miners to pop), but I expect it to be short-lived, before the USD short-covering rally resumes to around $94.50 DXY / $25 UUP with USD/JPY near $110.70. We did hit my 1st price target of $92.40 with DXY set out in late March, which is another reason why I suspect a quick fall will be forthcoming before heading higher to the 200D.
And why have I been so bullish the USD the past few months? Nature. When there exists a large structural short for the USD, globally, any inflation shock (read: oil spike) or financial panic (pick any: Iran, China, Russia, N Korea … ), there is bound to be a scramble for US Dollars by other countries to cover positions. (It is estimated that total USD cross-border claims are $13.7 trillion which is 18% of global GDP.) Add to that the COT short positions for USD that would need to cover/unwind, and we have $94.50 relatively quickly. Once there, however, the USD cycle, and the macro economic themes, strongly foretell another USD devaluation move closer to $80. And this is the bullish case for sending precious metals like Gold much higher.
Implicit Gold Message: US Dollar matters too!
Come join me… I made it super easy for you to trade with me: 1. Pop into my LIVE Trading Room any time you want. 2. Get real-time Portfolio tracking of my trades with SMS/Email. 3. Think big picture with my macro-to-micro investment newsletter. You can also subscribe to my Free Fishing Stories Blog/Videos and find me on Twitter. Thanks for reading and have a great weekend!
Twitter: @SamanthaLaDuc
Any opinions expressed herein are solely those of the author, and do not in any way represent the views or opinions of any other person or entity.


