In my 38-years I haven’t seen so many stock market indices testing Fibonacci extension levels at the same time.
S&P 500 (SPX), Dow Jones Industrials (DJIA), Russell 2000 (RUT), NYSE Composite (NYA), and more…
Fibonacci extensions tend to be price magnets/ targets. But they also tend to serve as resistance levels that bring consolidations or pullbacks.
That is, unless the market breaks out above them.
With so many markets testing critical Fibonacci price levels, it’s important for investors to stay tuned and monitor how the given markets ultimately react to them.
Below are several charts of key stock market indices highlighting their Fibonacci extension levels.
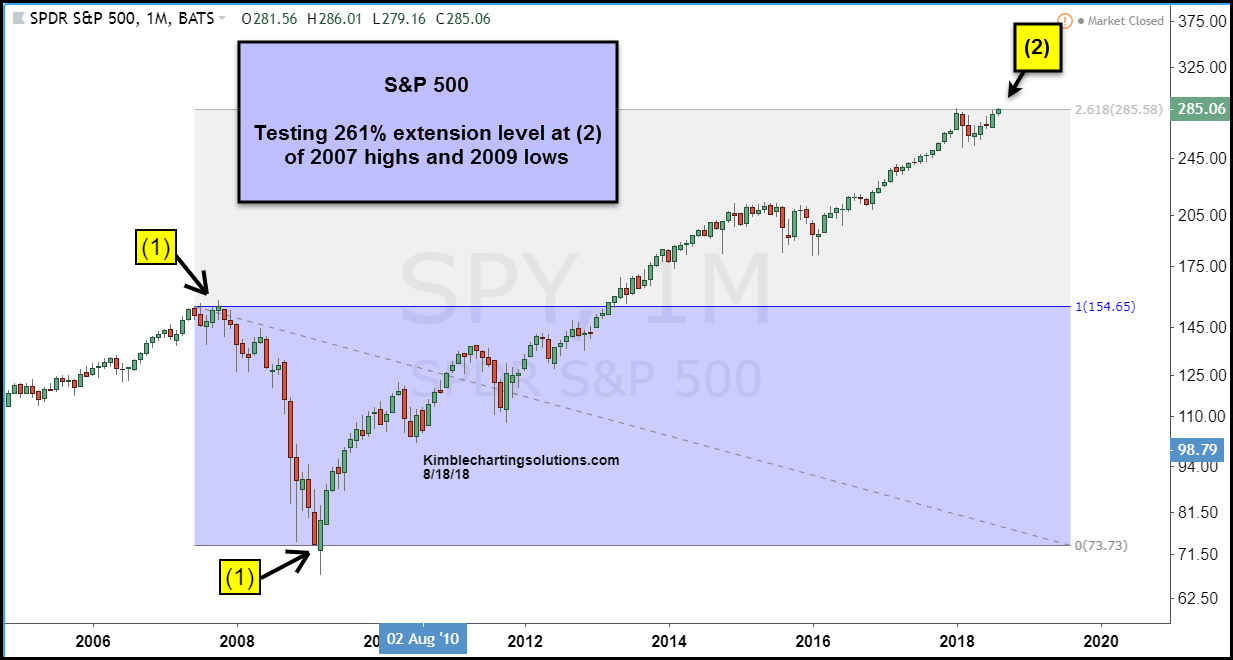
S&P 500 (monthly chart)
The S&P 500 is testing its 261% Fibonacci extension level at point 2. This level bought a correction in the stock market earlier this year. Will it continue to hold and bring another pullback? Or will bulls be able to break out above this level?
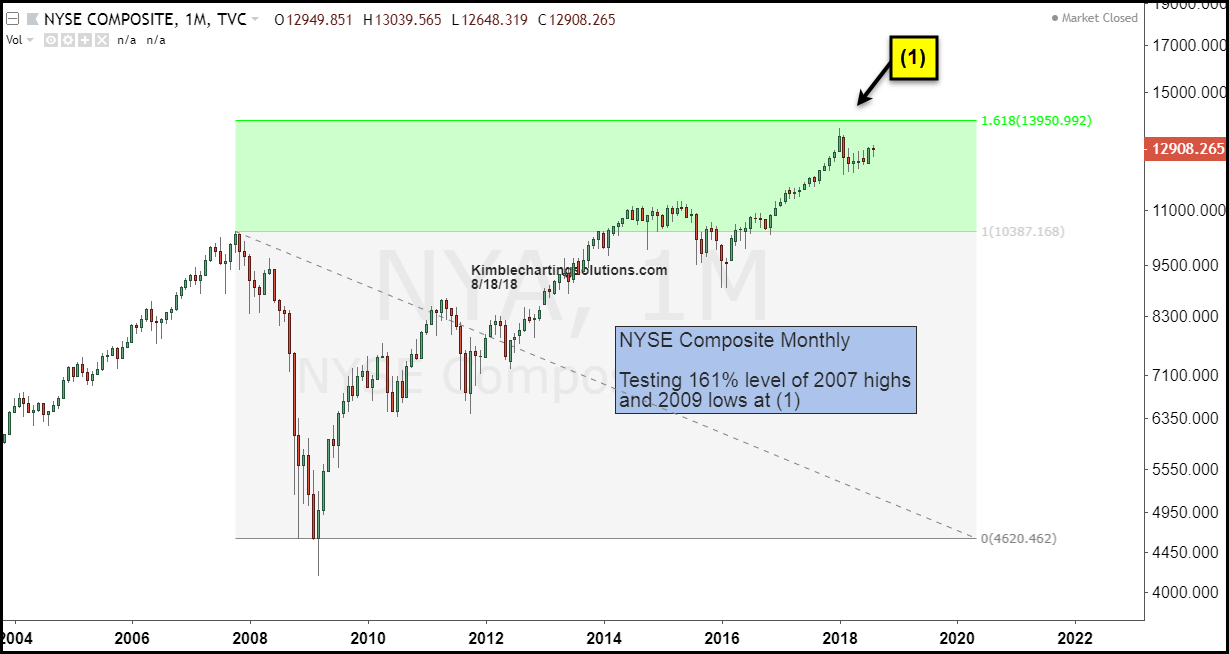
NYSE Composite (monthly chart)
The NYSE Composite peaked near its 161% Fibonacci extension (point 1). It’s been lagging of late. Warning sign?
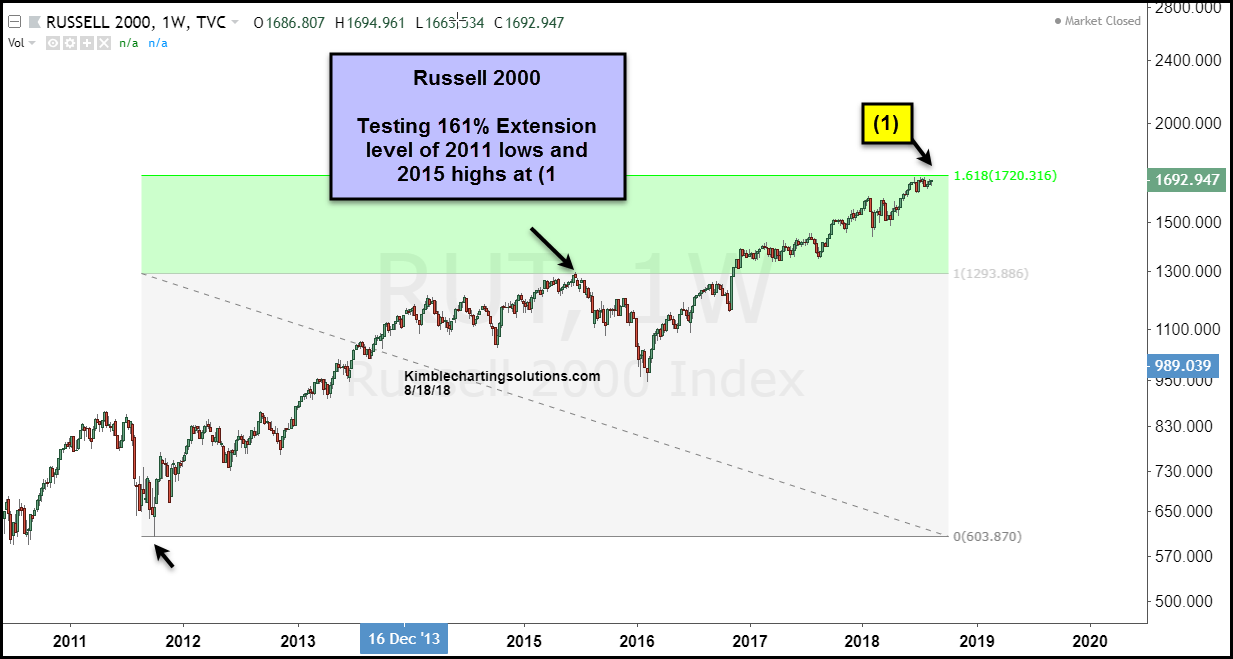
Russell 2000 (weekly chart)
The small cap index has been testing its 161% Fibonacci extension. Considering that the Russell 2000 has been a market leader – and a high beta sector – its next move will be important.
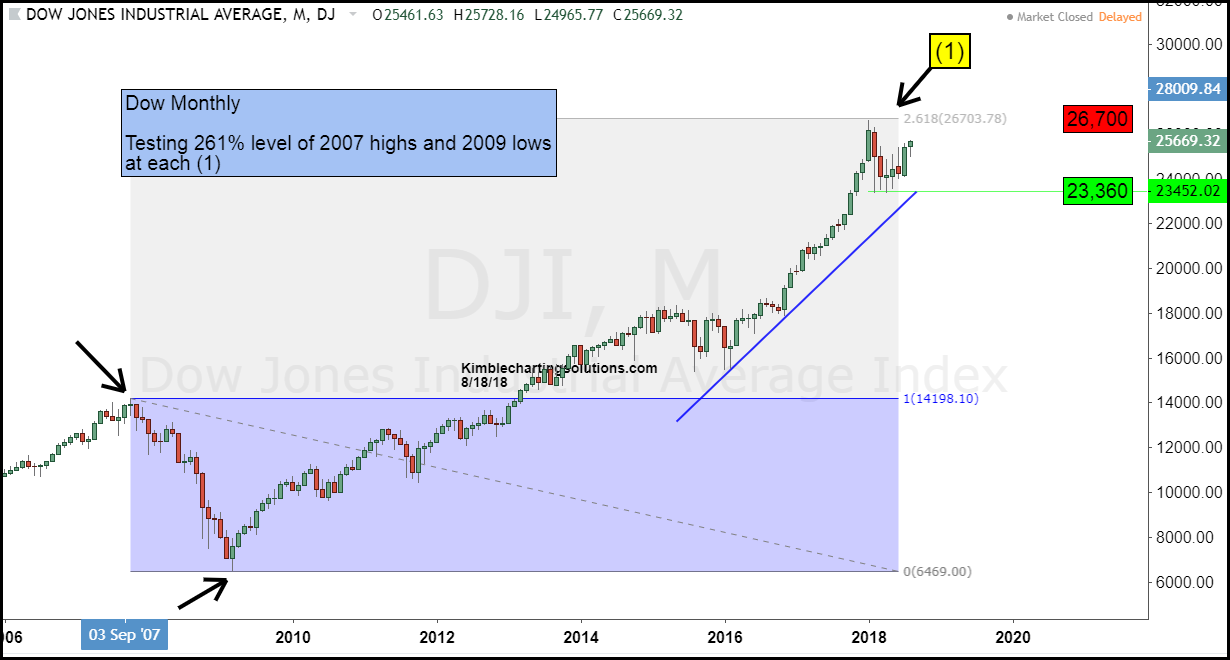
Dow Jone Industrial Average (monthly chart)
The Dow Industrials struggled after hitting its 261% Fibonacci extension (point 1). It’s currently coming up for a retest… will it breakout… or fail here?
JP Morgan (monthly chart)
Even the banks are getting in on the Fibonacci extension action. JP Morgan has been testing its extension for the past several months.

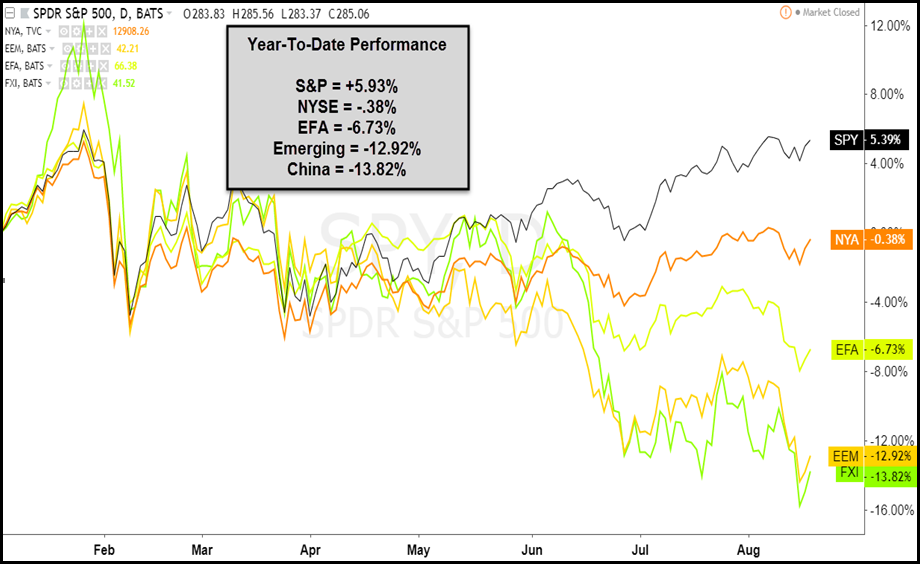
With the S&P 500 up and so many other indices around the world lower, the billion dollar question becomes: Can the U.S. stock market breakout and pull other markets up along with it? …Or will declining world markets keep U.S. markets from breaking out above Fibonacci extension levels and drag it lower?
Global Stocks Performance
Note that KimbleCharting is offering a 30 day Free trial to See It Market readers. Just send me an email to services@kimblechartingsolutions.com for details to get set up.
Twitter: @KimbleCharting
Any opinions expressed herein are solely those of the author, and do not in any way represent the views or opinions of any other person or entity.
: Cup (and Maybe Handle) Watch")
 Trading Near Top Of Price Range")
 Reaches Important Price Support")