Key Takeaways:
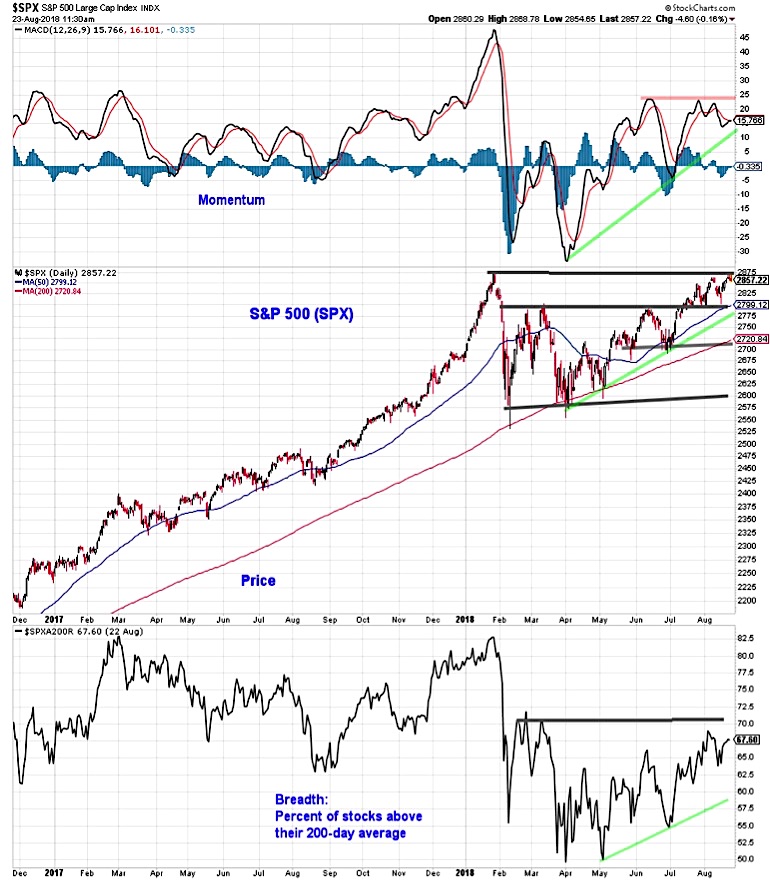
The S&P 500 (INDEXCBOE:.INX) has not been able to follow other indexes to new highs as momentum and stock market breadth have failed to provide an all-clear.
The rally off of the mid-year lows has failed to produce a breadth thrust for stocks, representing a conspicuous lack of rally confirmation. Bond yields and commodity prices declining are not consistent with an increased appetite for risk among investors.
Digging Deeper
This week’s test of the January highs for the S&P 500 (NYSEARCA:SPY) came with some index-level support (the Russell 2000 and Dow Transports both made new highs), though internal measures of both stock market breadth and momentum continue to lag the price-level improvements.
Negative momentum divergences (where price gains are not accompanied by strong momentum) are present not just on the S&P 500, but also on areas of the market that have made new highs (like the Russell 2000 and the Dow Transports). Of perhaps even greater note has been the lack of broad market strength accompanying the S&P 500 test of its January highs. In particular, the percentage of stocks trading above their 200-day averages remains shy of its March high, let alone the January peak.
A break above 70% by this market breadth indicator could be evidence that the broad market is getting back in gear. On a positive note, these indicators are all making higher lows even if breakouts have been elusive.
Too often discussions get sidetracked by a realization that two sides using the same word mean two different things. This past week’s discussion about the age of the current bull market is a great example of this (not surprisingly, different definitions of what constitutes a bull/bear market will yield different answers about its age). As an aside, regardless of how you define a bull market, the timing of market cycles is not of much real-time use.
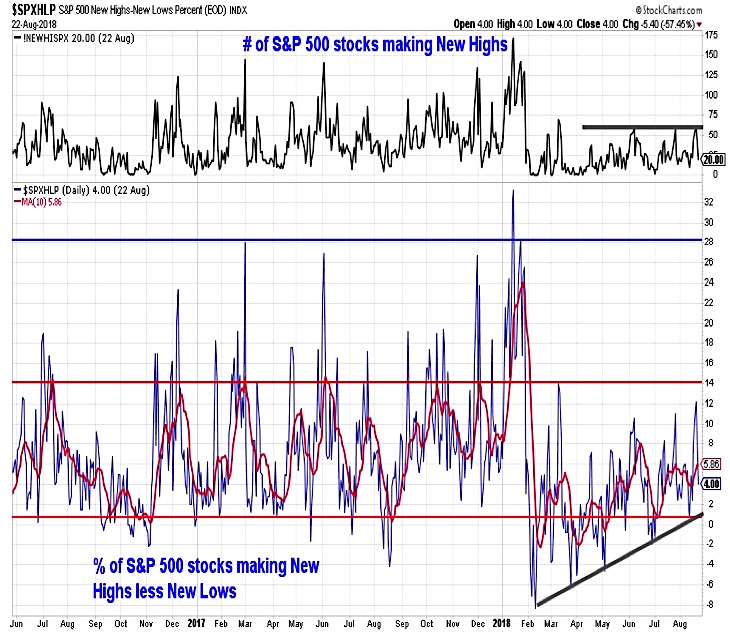
Market breadth is another such example – the same general term is applied to a host of different meanings. We need to be sure to clarify what we mean as we discuss market breadth. On the first page, we showed the percent of stocks trading above their 200-day averages, coming up we will look at the number of stocks making new highs.
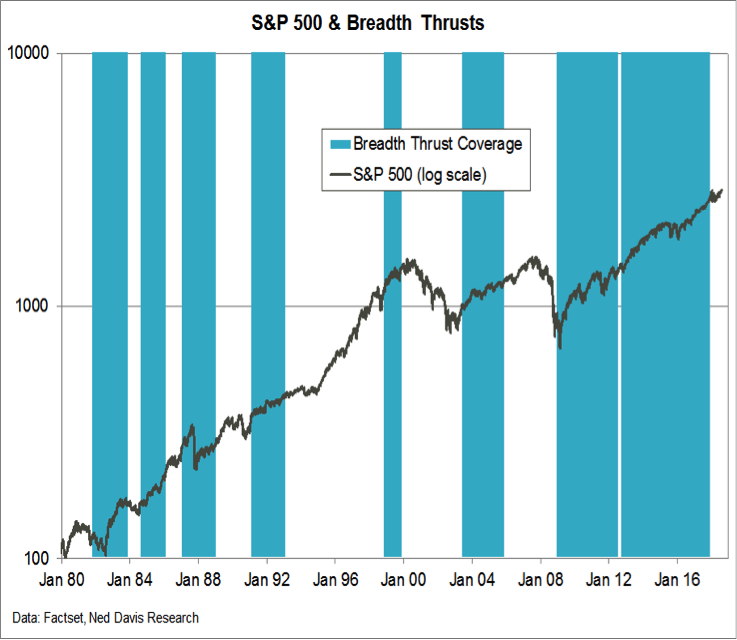
One of the more powerful indicators from a market breadth perspective is the emergence of breadth thrusts (as defined by the ratio of advancing stocks to declining stocks exceeding 1.9 over a 10-day period). The table above shows 48 instances of such breadth thrusts emerging since 1947 and the market gains that tend to follow in their wake.
The chart below shows that since 1980 the market has been covered by a breadth thrust signal (i.e., the most recent signal was less than one year in the past) nearly half the time. During such periods, the S&P 500 rose at a better than 12% annualized rate. When not covered by a breadth thrust signal, the S&P 500 saw gains of less than half that. The most recent breadth thrust (from November 2016) expired in November 2017. The rally off of the 2018 lows has, at least so far, failed to produce a new breadth thrust.
Looking at the number of stocks making new 52-week highs (on an absolute basis and relative to the number of stocks making new lows) provides a similar conclusion to that drawn by looking at the percentage of stocks trading above their 200-day averages. We are seeing a series of higher lows but also a lack of upside progress. The number of S&P 500 stocks making new highs has waned as this week has progressed and has remained shy of the number of new highs seen in July or June or March or January. Getting number of stocks making new highs above 75 on a single day basis (or on a 10-day average basis seeing the % of stocks making new highs less new lows exceed 8%) would be evidence that rally participation is expanding.
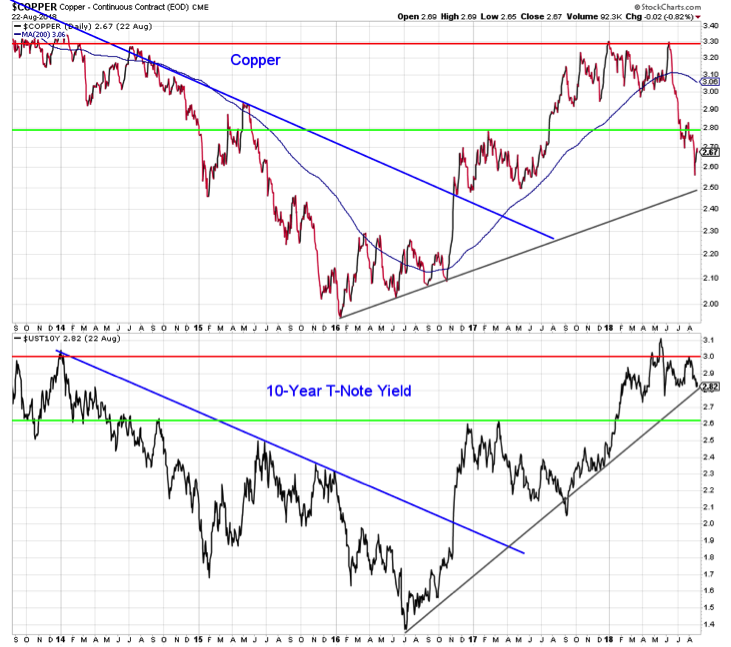
In addition to seeing a lack of conviction from momentum and breadth indicators, commodity and fixed income markets have not endorsed the S&P 500’s challenge of it is January highs. Copper prices have weakened substantially since peaking in June, but remain above the longer-term trend line that is currently near 2.5. The yield on the 10-year T-Note has been closer to the bottom of its recent range (2.8%) than the top (3.0%). With weakness in copper ongoing and German Bund yields having fallen from their recent peak, a test of 2.6% on the 10-year T-Note might not be out of the question. If risk appetites were indeed improving, it seems more likely that yields would be challenging 3.0% on their way to testing 3.1%.
Twitter: @WillieDelwiche
Any opinions expressed herein are solely those of the author, and do not in any way represent the views or opinions of any other person or entity.


