
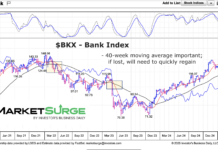
Bank Index Could Be Bellwether For Stocks, Economy
The stock market correction has several key stocks and sectors teetering on important support levels.
One such sector is the banking sector. Bank stocks are...

If U.S. Equities Stumble Here, Would Be Warning To Global Investors
It's been a heck of a run for U.S. Equities.
But as we enter uncertain times, we must ask ourselves if that leadership and out-performance...

Is U.S. Dollar Topping Pattern Pointing To Broader Concerns?
The U.S. Dollar Index rallied sharply into inauguration day. Since then, it's been very weak.
Could things get worse for King Dollar?
Today, we share a...
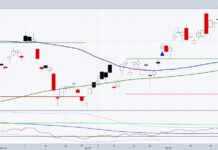
Silver (SLV) Having Its Day: What’s Next?
Monday’s daily column talked about Biotechnology. I would continue to keep that on your list as today it made a move above price resistance.
Yesterday...

2 Stocks for Turnaround Tuesday: $ADBE and $AMD
Could any more bad news hit the market?
Of course it can.
In the meantime, as an active investor, I have lots of cash to put...

A Standard Pullback in a Bull Market That Can Last
Markets pulled back, and sentiment went very negative already (which is good). This looks like a standard reset within an ongoing bull market rather...

Semiconductors ETF (SMH) Fails Key Support Level; What’s Next?
It has been 2 years and 2 months since the ETF for Semiconductors SMH has traded below the 50-week moving average.
The momentum, as seen...
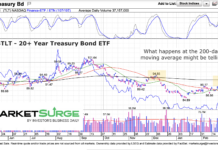
Treasury Bonds (TLT) Rally Nears Important Resistance
Treasury bond yields have turned lower over the past 6 weeks. And that means treasury bonds and the popular treasury bonds etf (TLT) have...

The Retail Sector (XRT) Weakness Remains; Sell Rallies?
Market volatility is showing up in fits and starts and some important sectors are underperforming.
While Tuesday I wrote about the strength of junk bonds...
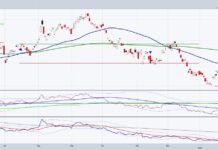
Long Treasury Bonds Indicator Says Risk OFF, But With a Twist
Turnaround Tuesday brought some interesting charts. What bulls do not want to see, is when long-dated treasury bonds (which have turned around) outperform both...