It’s been a heck of a run for U.S. Equities.
But as we enter uncertain times, we must ask ourselves if that leadership and out-performance may be pausing.
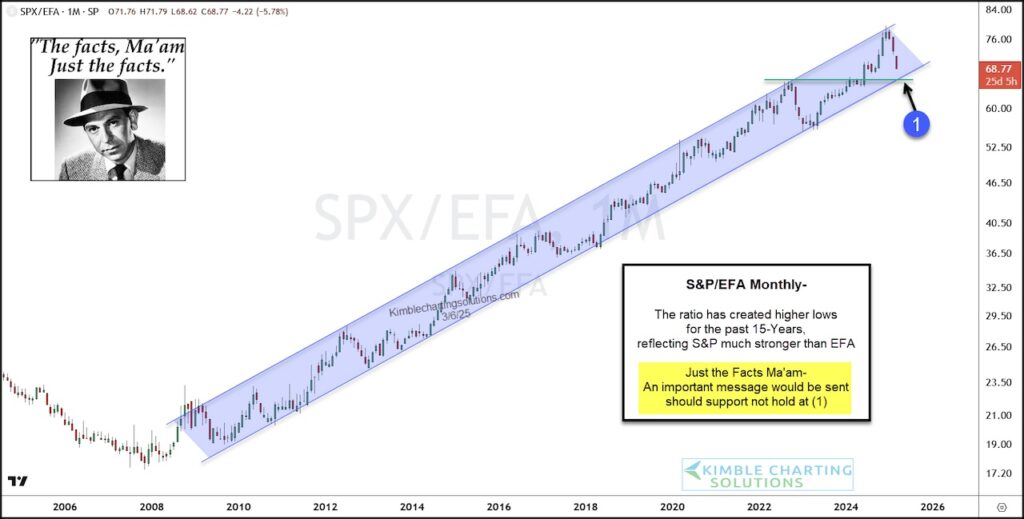
“The facts, Ma’am. Just the facts.” – Joe Friday
With the market experiencing increased volatility amidst fears of a broader selloff, it’s time to look at some market leadership indicators.
Today we focus on a “monthly” ratio chart of the S&P 500 Index (U.S. equities) to the Global equities ex U.S. and Canada (EFA).
As you can see, the S&P 500 has been stronger than EFA for the past 15-years. That leadership has lead kept the global markets in a relatively good place.
But the recent selloff has seen the S&P underperform and the ratio is now testing important dual support at (1). This support comprises of its channel up-trend line as well as horizontal support at its prior highs.
In my humble opinion, it is quite possible that an important (and worrisome) message would be send to investors should support fail to hold at (1). Stay tuned!
S&P 500 Index / Developed Markets ex U.S. & China (EFA) “monthly” Ratio Chart
Twitter: @KimbleCharting
The author may have a position in mentioned securities. Any opinions expressed herein are solely those of the author, and do not in any way represent the views or opinions of any other person or entity.
: Creating Bullish Divergence?")


 and Semiconductors (SMH): Concerning Price Pattern?")


