Amazon (AMZN)
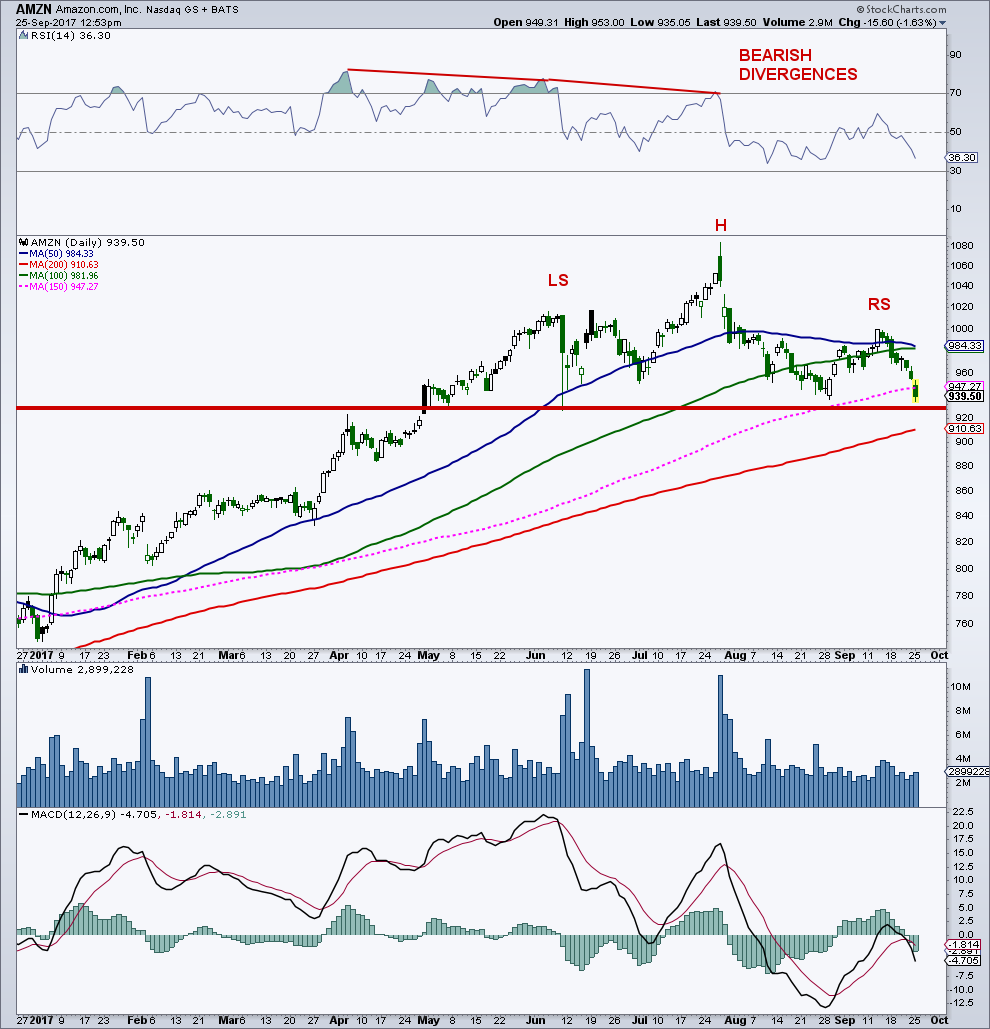
Most worrisome chart of the four as close to completing a very large head-and-shoulders formation. Must break neckline near 927 to complete pattern. Watch for 200-day at 911 as potential support just under neckline. Have seen many leaders trace out false breakdowns. Otherwise, a break through neckline and 200-day could then see 100+ point decline.
Amazon Stock Chart
Overall, the major NASDAQ Composite components are on shaky ground so it’s best to stay clear until the dust settles.
Feel free to reach out to me at arbetermark@gmail.com for inquiries about my newsletter “On The Mark”. Thanks for reading.
Twitter: @MarkArbeter
The author may have positions in related securities at the time of publication. Any opinions expressed herein are solely those of the author, and do not in any way represent the views or opinions of any other person or entity.


