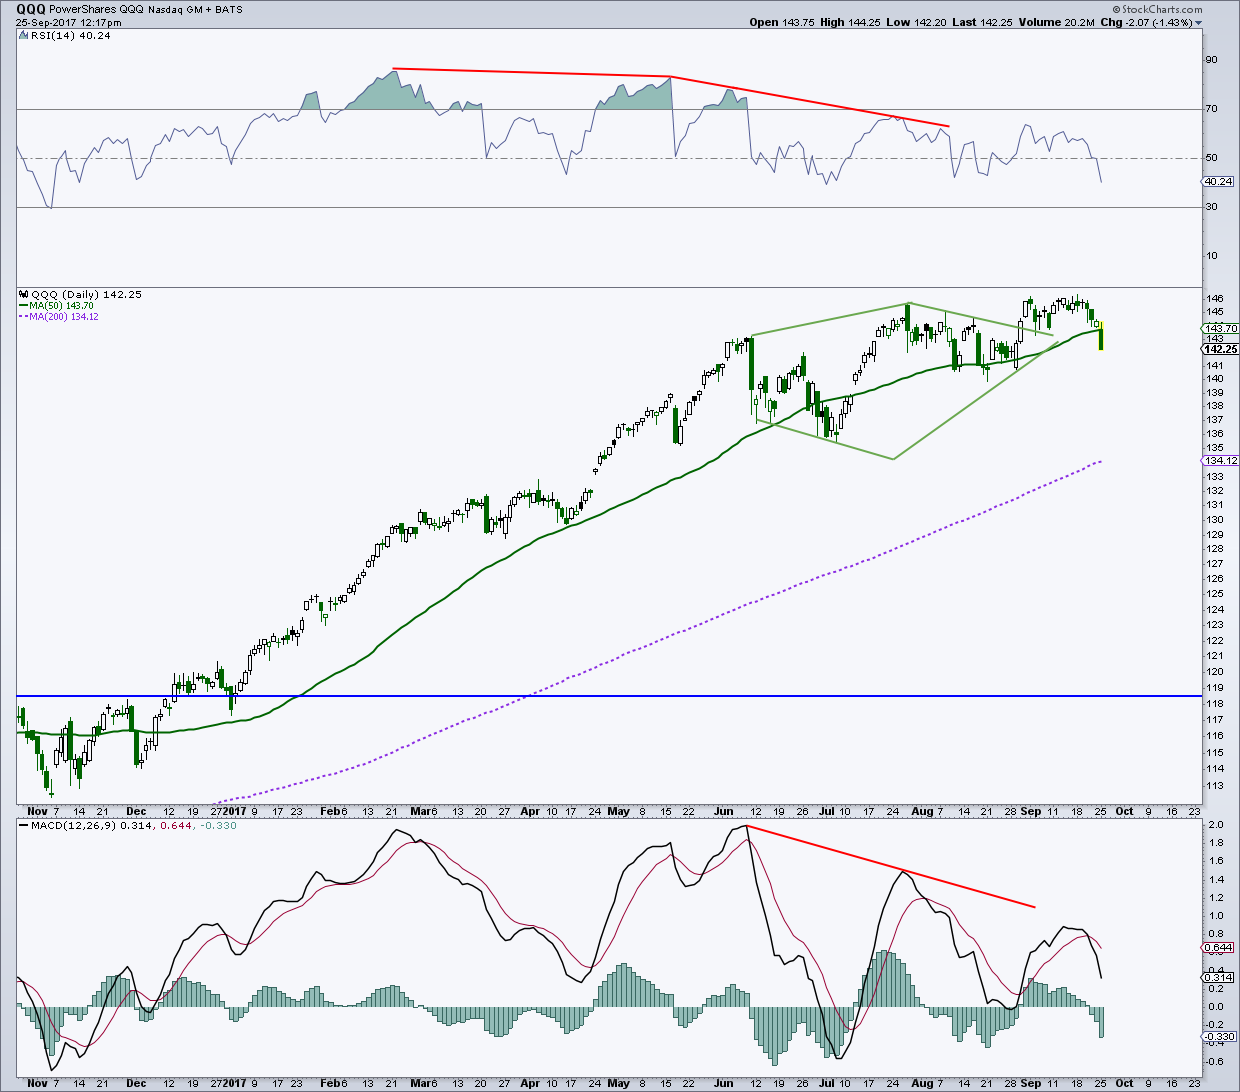
I have been concerned about the Nasdaq 100 QQQ PowerShares ETF (NASDAQ:QQQ) and the NASDAQ Composite (INDEXNASDAQ:.IXIC) since last month when we saw another breakout failure and then formed the diamond pattern shown in the chart below.
The Nasdaq 100 has fallen 4 days in a row, while the Nasdaq Composite is down 3 out of the past 4 sessions. As well, the major tech stock indexes have been choppy for the past few months.
Today we’ll look at the indexes, along with charts of Apple (NASDAQ:AAPL), Google (NASDAQ:GOOGL), Facebook (NASDAQ:FB), and Amazon (NASDAQ:AMZN).
Caution Warranted
This is the that chart I posted in the newsletter as the diamond pattern was forming. To fool the masses, the QQQ’s then broke out of this formation to the upside and then failed again. Note all the bearish momentum divergences after each high was made over the summer.
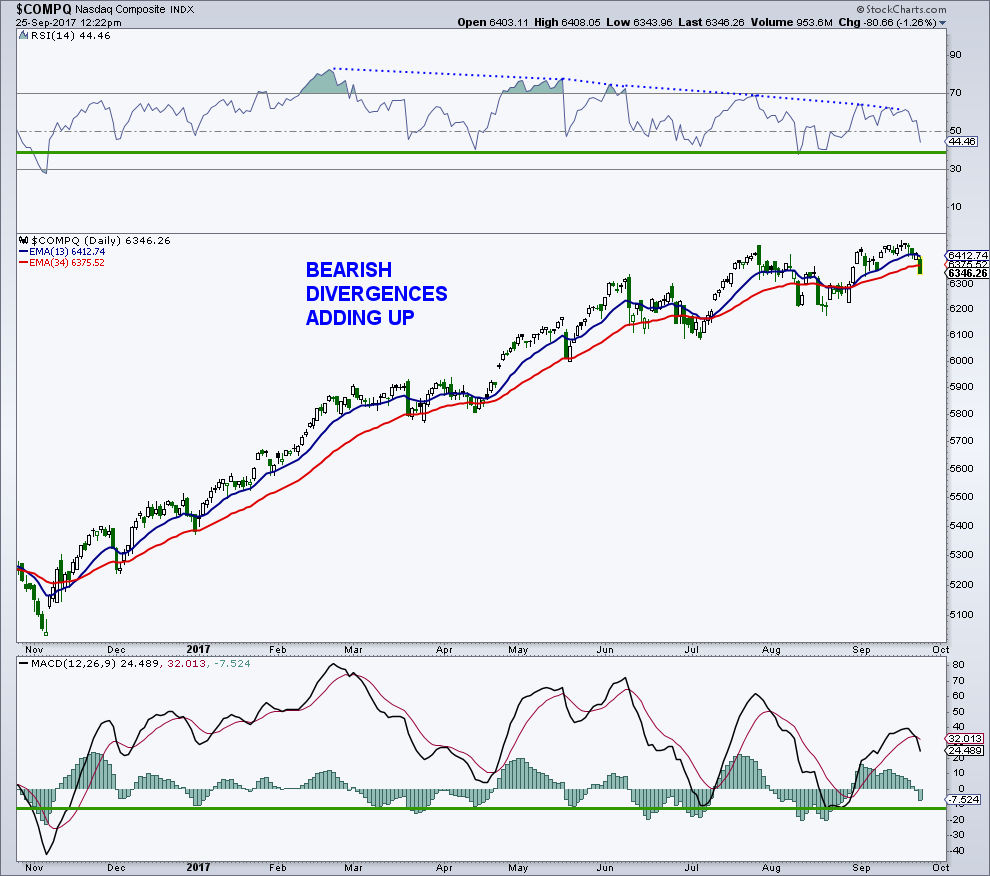
Here is a NASDAQ chart I showed in the September 14 “On The Mark” entitled New Highs, BUT…
A ton of momentum divergences, a concern, but no real damage yet.
Major Components
Now let’s look at some of the major component charts of the NASDAQ including Apple (AAPL), Google (GOOGL), Facebook (FB), and Amazon (AMZN), or 4 out of the 5 largest weightings for the index.
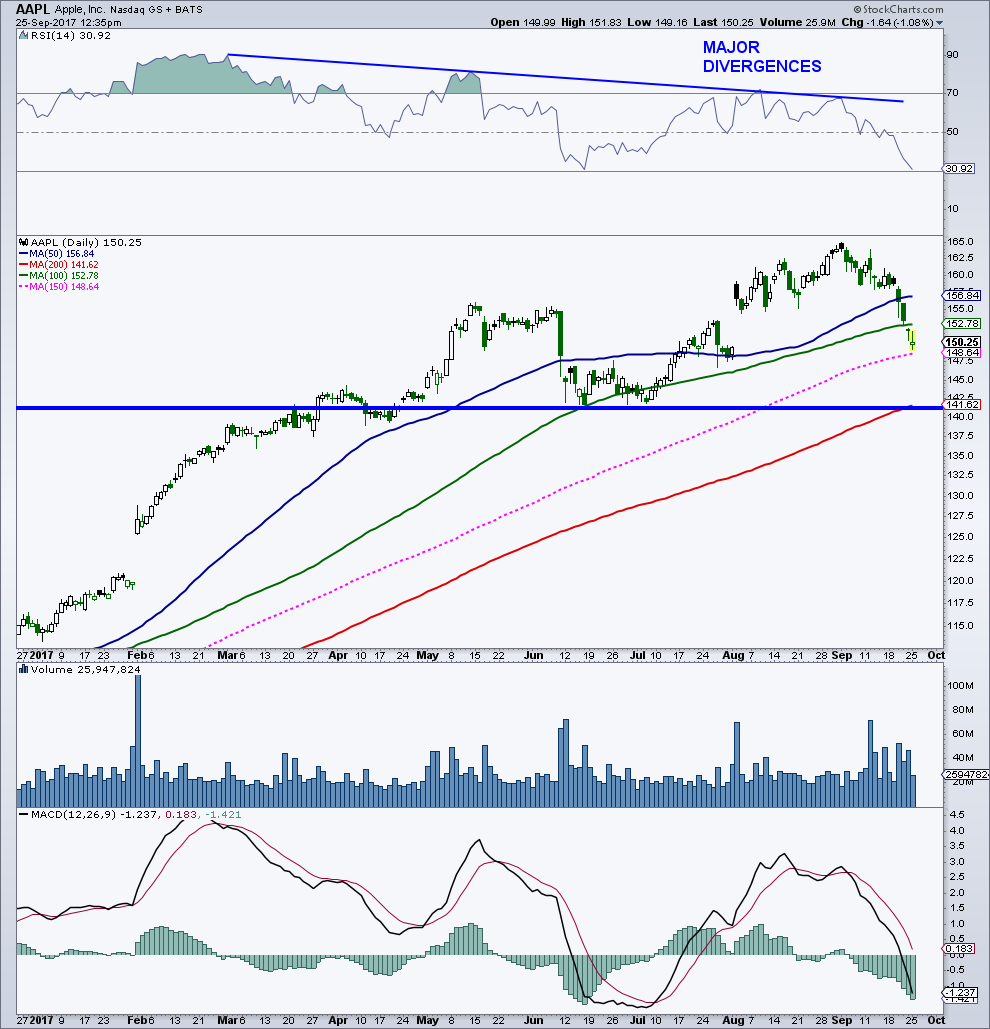
Apple (AAPL)
Major momentum divergences. Latest slide has seen big pickup in volume. Key area of chart support near 140. Also location of rising 200-day average.
Google stock chart analysis on next page…


