Google (GOOGL)
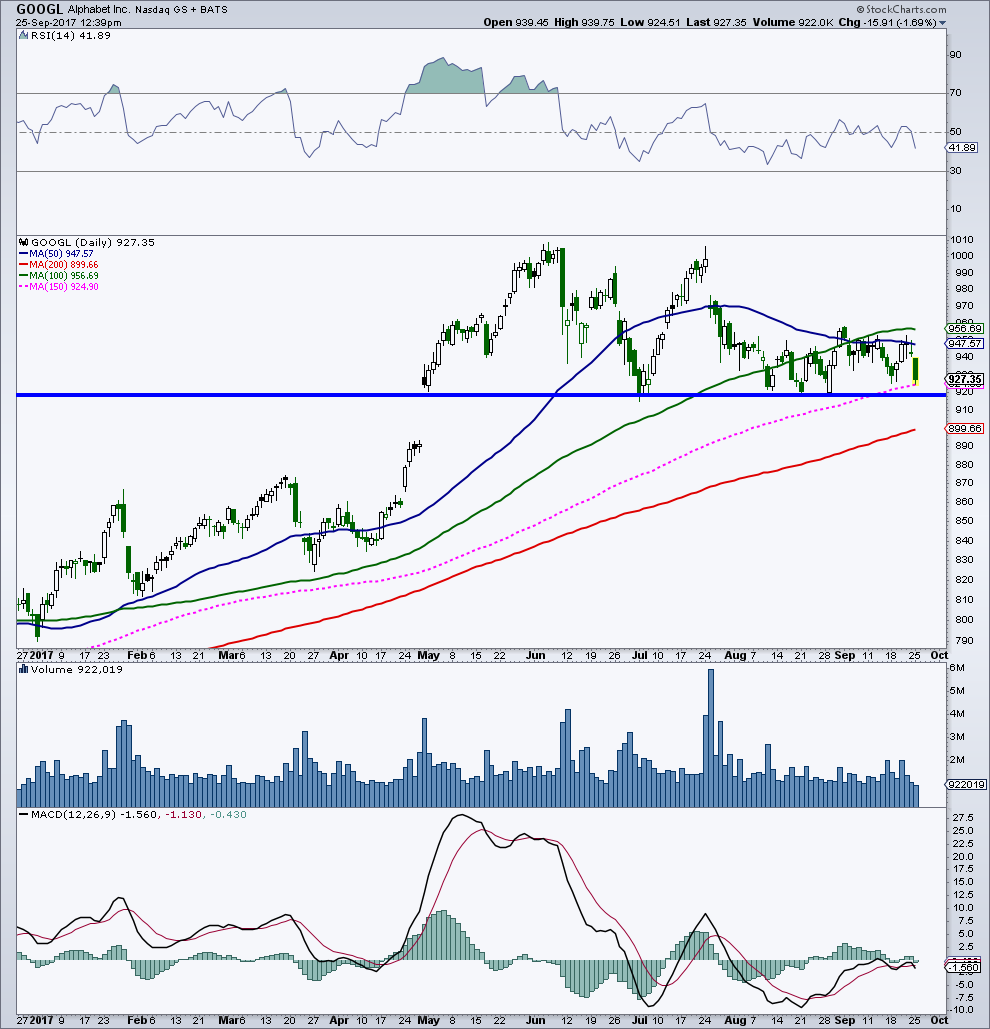
Approaching key chart support near 918. Rising 200-day at 900 with gap support down to 893. Daily MACD having a hard time getting back in positive territory while 14-day RSI below 50. This combination of daily momentum is where major losses typically occur.
Google Stock Chart
Facebook stock chart analysis on next page…


