Don’t believe in the power of Fibonacci price levels?
Perhaps this two-pack of stock market charts will change your mind.
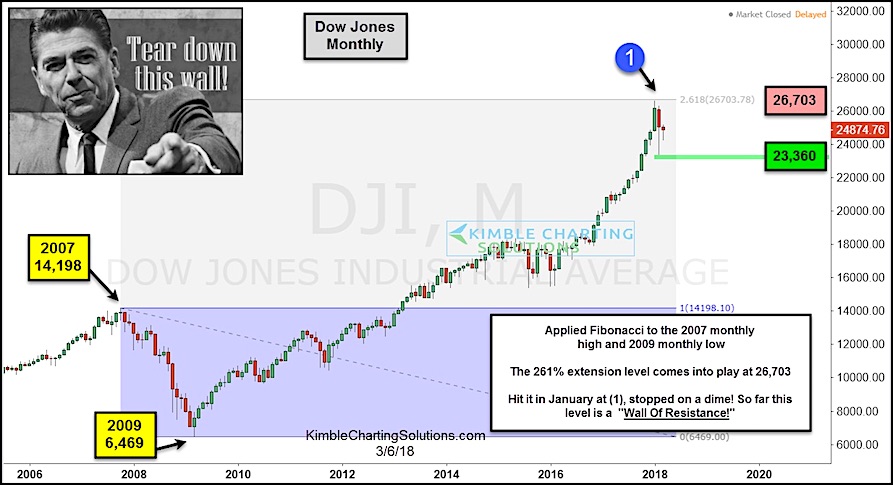
Back in late December, I warned that we were approaching the 261.8 Fibonacci resistance level on the Dow Jones Industrials:
“We are now at the 261.8 Fibonacci price level. Will this level bring market turbulence… sideways, lower, etc… ? Stay tuned.”
So what happened after hitting this level? Well, all kinds of win streaks ended. Market volatility picked up and investors saw the quickest 10% decline in history from all-time highs. Will this become a “wall of resistance”.
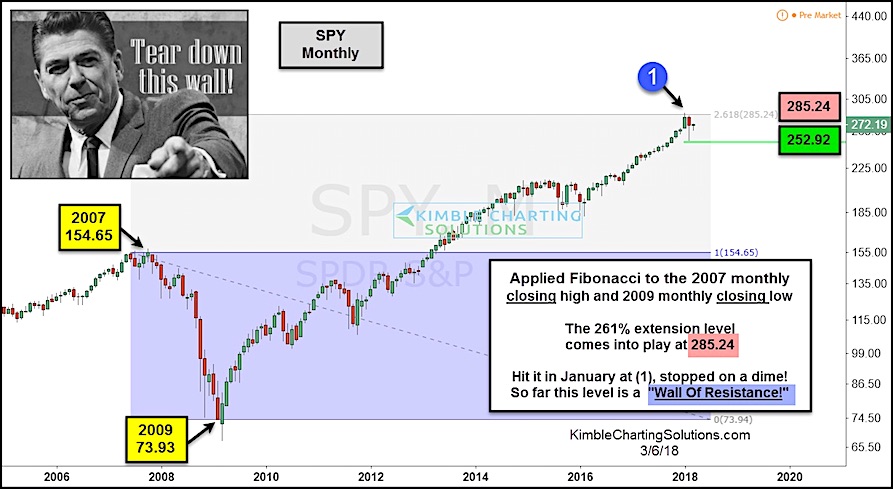
The exact same thing occurred on the S&P 500 chart further below. Coincidence?
Once this level was hit, both the Dow Jones and S&P 500 produced “hangman” candle patterns the following month (February).
Yes, bulls may have trouble tearing down this wall of resistance!
Dow Jones Industrials – 261.8 Fibonacci “Wall”
S&P 500 – 261.8 Fibonacci “Wall”
Note that KimbleCharting is offering a 30 day Free trial to See It Market readers. Just send me an email to services@kimblechartingsolutions.com for details to get set up.
Twitter: @KimbleCharting
Any opinions expressed herein are solely those of the author, and do not in any way represent the views or opinions of any other person or entity.
: Cup (and Maybe Handle) Watch")
 Trading Near Top Of Price Range")
 Reaches Important Price Support")