The Dow Jones Industrial Average has had a good year in 2017.
Actually, it’s had an excellent year. Make that two years.
This bull market has continued longer than many expected. There have been tests along the way… and we are approaching another one.
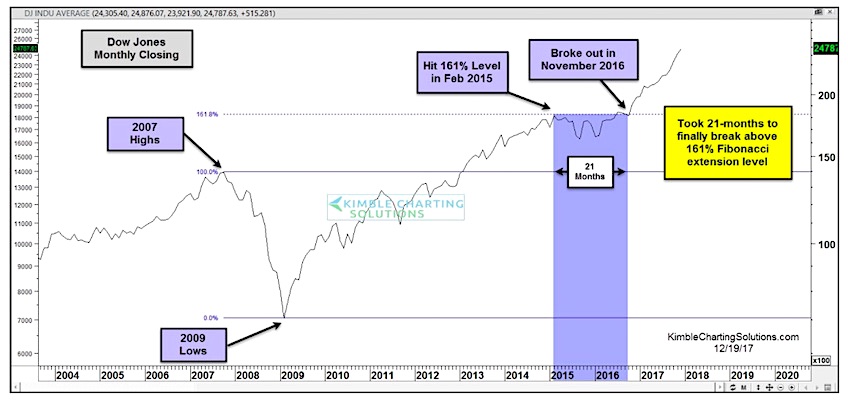
Back in 2015, the Dow Jones Industrials hit the 161.8 Fibonacci extension (when using the o7-09 stock market decline). See the chart below.
What ensued over the next 20+ months was a period of sideways / volatile price action.
Dow Jones 1.618 Fibonacci Resistance Chart
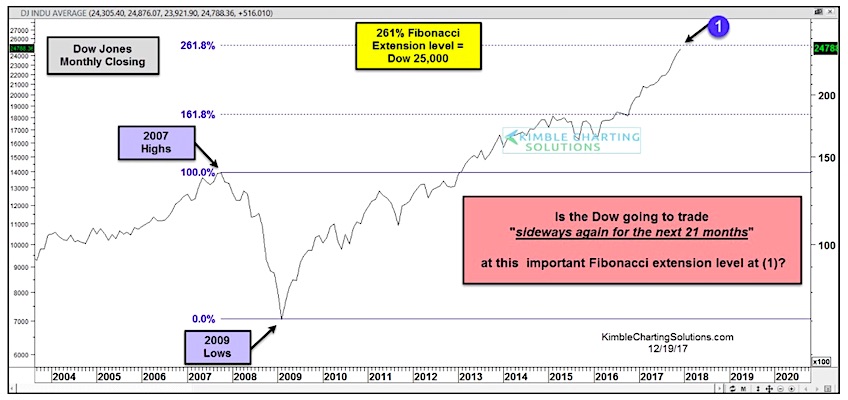
Last year, we broke out above that level. And we are now at the 261.8 Fibonacci price level. Will this level bring market turbulence… sideways, lower, etc… ? Stay tuned.
Dow Jones 2.618 Fibonacci Resistance Chart
Twitter: @KimbleCharting
Any opinions expressed herein are solely those of the author, and do not in any way represent the views or opinions of any other person or entity.


