The first two months of 2018 are in the books and it is safe to say that the stock market has been a tale of two months.
While January was all about the mo-mo, February was all about the volatility with the major stock market indices falling 10-15% before rallying to recoup a majority of their monthly losses. Make no mistake, both months were historic.
January “Mo-Mo”
I penned several posts in January and early February about rising risks for investors. In January, I highlighted how the Dow Industrials and Transports were testing the top of 70 and 30 year rising channels respectively. And in early February I showed how the Nasdaq was also testing the top of its current bull market channel at the same time that the Dow Industrials was hitting RSI momentum levels not seen since the highs of 1929, 1987, 2000, and 2007.
February “Hanging Men”
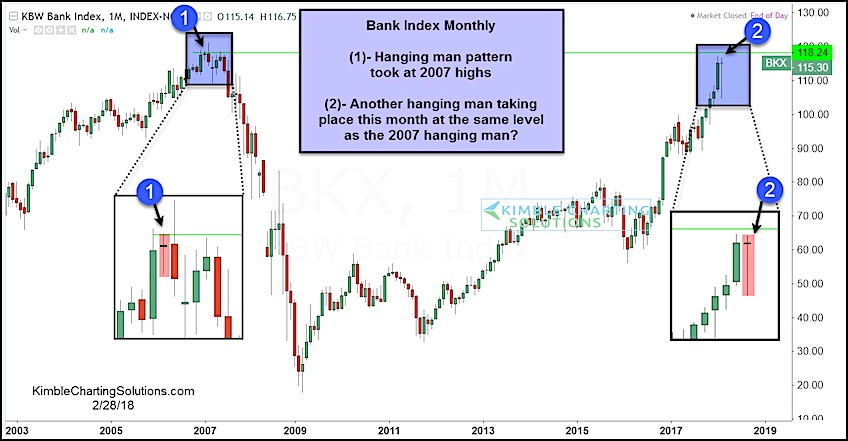
The swift stock market correction and ensuing recovery formed bearish “monthly” hanging man candlesticks across the major stock indices. Could this be the setup that bears have been starving for?
Here’s the definition of a Hanging Man candlestick from Investopedia:
A hanging man is a bearish candlestick pattern that forms at the end of an uptrend. It is created when there is a significant sell-off near the market open, but buyers are able to push this stock back up so that it closes at or near the opening price. Generally, the large sell-off is seen as an early indication that the bulls (buyers) are losing control and demand for the asset is waning.
To be clear, this candlestick does not definitively mean the uptrend is over nor does it mean that a bear market is underway. But February’s “monthly” candlestick, coupled with January’s extreme momentum readings, is offering bears their best opportunity in several years. The question is, will they take it?
It is worth noting that should price exceed the high of February’s “hanging man candlestick”, it would point to bullish continuation (Investopedia).
Chart Review
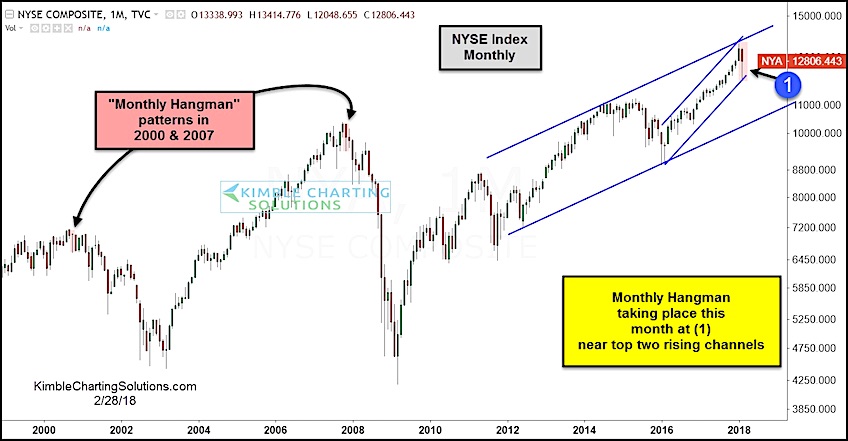
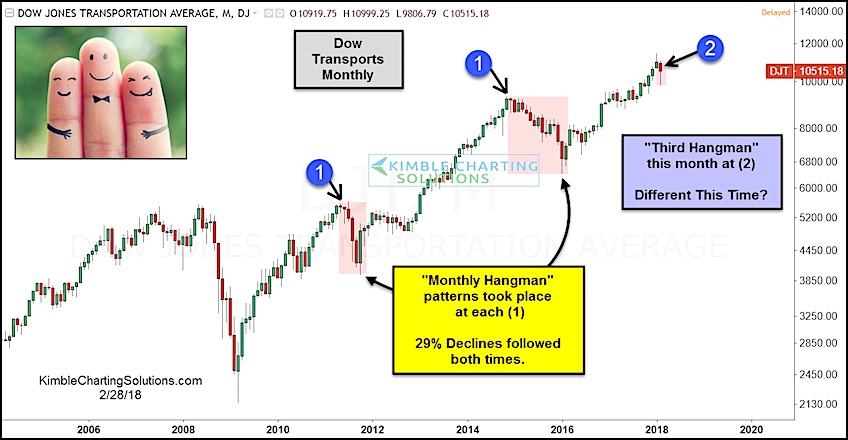
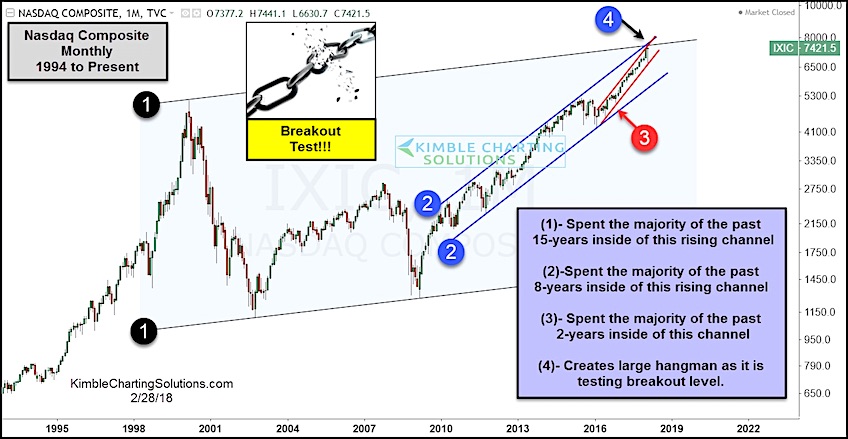
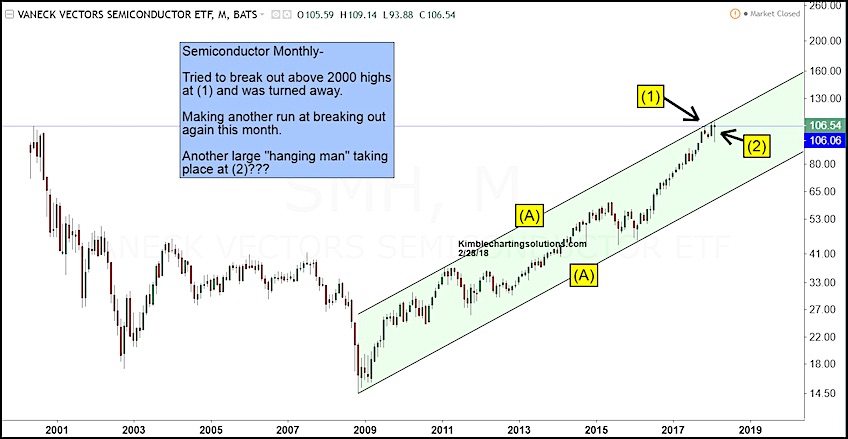
Here’s a look at the “monthly” charts of several key stock indices and ETFs. Take note of the bearish “monthly hangman” candlesticks that formed this month… vs those in years past. Several were pre-cursors to stock market corrections and bear markets.
NYSE Composite Index – Monthly Chart
Dow Jones Transportation Average (SMH) – Monthly Chart
Nasdaq Composite – Monthly Chart
VanEck Semiconductors ETF (SMH) – Monthly Chart
KBW Bank Index – Monthly Chart
Note that KimbleCharting is offering a 30 day Free trial to See It Market readers. Just send me an email to services@kimblechartingsolutions.com for details to get set up.
Twitter: @KimbleCharting
Any opinions expressed herein are solely those of the author, and do not in any way represent the views or opinions of any other person or entity.


