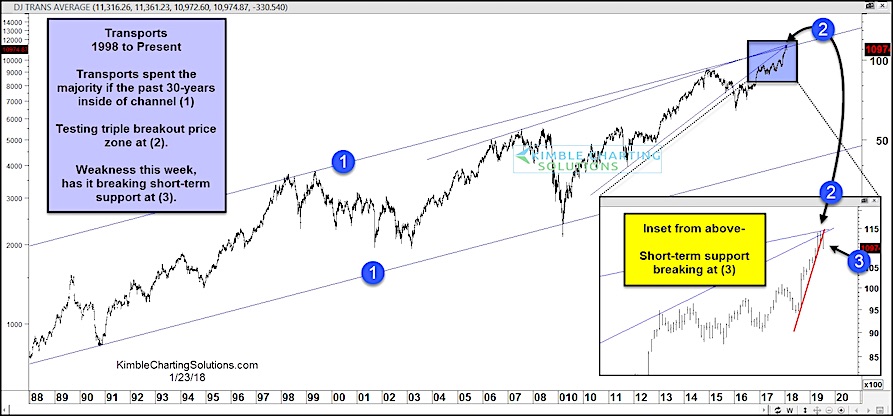
For the past 30 years, the Dow Jones Transportation Average has traded within a wide price channel (marked by 1’s on the chart below).
On a few occasions, the Transports have reached the top of this channel, last week being one of them (see point 2 on the chart below).
The other times resulted in price corrections. What are the implications for the broader stock market? Will it be different this time?
The Transports are already showing some weakness here. In the “zoomed-in” box in the lower right hand corner, you can see that the Transports are breaking down through short-term support (point 3).
Although this isn’t a sign that a deep correction is imminent, it is reason enough to stay engaged. The Transports a big part of the economy and broader stock market. And due to their cyclical nature, investors don’t want to see them decline too far here.
In my humble opinion, investors should put the Transports on their radar!
Dow Jones Transportation Average – 30 Year Chart
Thanks for reading.
ALSO READ: Are Commodities On The Brink Of A Major Breakout?
Twitter: @KimbleCharting
Any opinions expressed herein are solely those of the author, and do not in any way represent the views or opinions of any other person or entity.


