Market cycles don’t die of old age, and that is good news as this bull market cycle can only be described as being “rather mature”.
Just a reminder, we do not view the market cycle in terms of bull and bear markets for a specific index.
From our perspective, the end of a cycle is a bear market/recession combination, something the North American markets have not seen since 2008/09.
Using this criterion makes the current bull market cycle the second longest since 1950. While that does make it a mature cycle, the foundation remains supportive…at least for now.
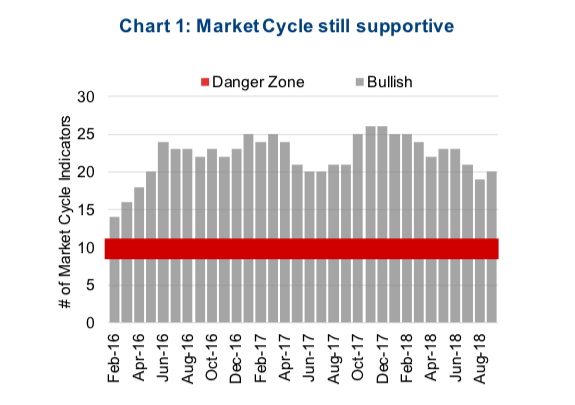
Our Mark et Cycle Framework incorporates over 30 indicators that have all historically proven valuable in signalling a turning point in the market cycle, both at the end and at the beginning of a new cycle. Typically, when the number of indicators that are bullish drop to 10 or below, there is a high probability that the end of a current bullish cycle has, or is about to occur.
As of today, 20 of the 30 indicators in our Market Cycle Framework are bullish. This isn’t as positive as a few months ago, but we remain well above the danger zone (see chart 1 below).
From an asset allocation perspective, this keeps us in the camp that this current bull market cycle still has room to run. The U.S. economic data remains encouraging, as do company fundamentals. Earnings growth is robust, with sales growth and margins remaining healthy. Globally, things are a little more mixed with our international indicators scoring only 4 out of 7. This is enough good news to help markets.
Markets are getting skinny
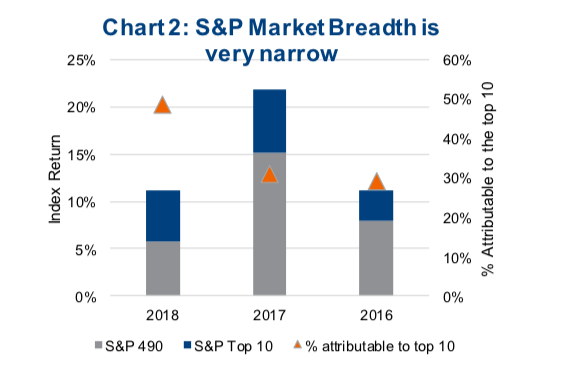
One aspect that continues cause concern is market breadth, with market leadership continuing to narrow (not uncommon late in a market cycle). Starting in the U.S. equity market (leading global markets), the S&P 500 is up +11% so far this year. A very impressive run, clearly.
However, if you remove the top 10 companies, the market is only up +5.7%. In other words, 2% of the companies in the index are responsible for about 1⁄2 of the gains this year. Compare this to the past couple years, when the top 10 represented approximately 30% of the gains. Narrow market leadership is a common characteristic during the late stages of a cycle, but does not necessarily mean the end of the cycle is near, it is just another factor that investors should be aware.
The narrow leadership is not just in the U.S. equity market. Year-to-date data for the TSX is a little different as our index is barely up on the year and the top 10 represent more than all the gains. Looking back a full year, the TSX is up +8.5% with the top 10 representing +6.0% of the increase. If you didn’t own any of the top 10, it’s been a tough year in Canada.
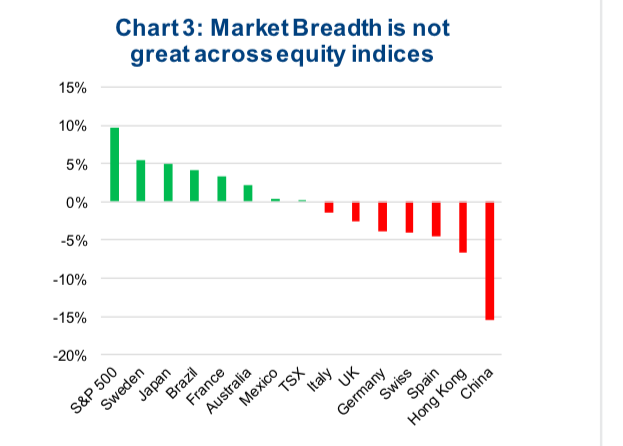
Looking at international markets, leadership is narrow as well. The U.S. equity markets are clearly the leaders, but outside the U.S., gains have been much harder to come by. Chart 3 (below) shows the major global equity markets year-to-date price returns (in local currency). While there are some greens other than the U.S., there have also been some troubled markets.
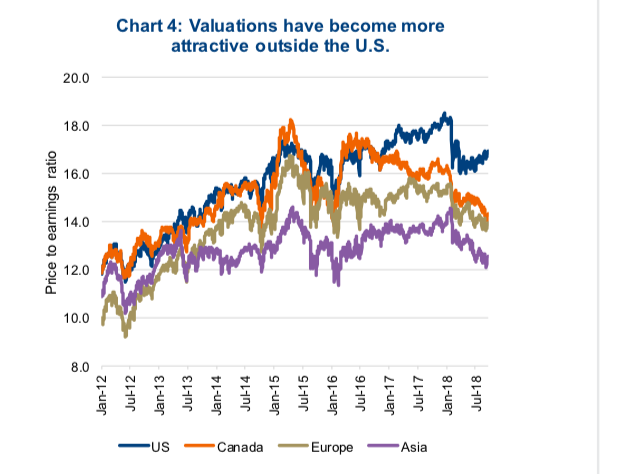
There is one silver lining to the poor performance of most international markets : valuations are becoming much more appealing.
The U.S. equity market is not trading at 16.9x, which is about a 5% lower valuation than a year ago. Compare that with the TSX at 14.3x , 12% lower; Europe at 14.0, 8% lower; and Asia at 12.6x, 8% lower.
Portfolio Implications
While we do not believe the end of this bull market cycle is imminent, the spread in valuations is becoming more interesting. Usually, with lower valuations comes less risk as this often is a more attractive entry point. Plus, while we would not bet against the U.S. equity market at this point, it is often the highest flying markets late in the cycle that suffer the most when things go the other way. This may be a good time to go a little more international.
Charts are sourced to Bloomberg unless otherwise noted.
Twitter: @sobata416 @ConnectedWealth
Any opinions expressed herein are solely those of the authors, and do not in any way represent the views or opinions of any other person or entity.


")
