With the U.S. Dollar Index poised to embark on the next leg of its climb, as we highlighted in our currency post earlier this month, it may be time for crypto-currency investors to evaluate any long positions and maybe take some profits.
Today’s post examines prospects for CME Bitcoin Futures (BTC) in the context of price, pattern and timing.
In terms of pattern, we are tentatively classifying the year-long rise in Bitcoin from spring 2020 as the middle wave in a larger upward impulse. The rise itself counts as impulsive as wave [iii] should, and the move was quite strong.
From that viewpoint, it makes sense to analyze the price action since April 2021 as a potential fourth wave. The internal structure of the decline from April into June suggests the correction is not yet complete, needing another downward element. Ideally it would present a corrective 5-3-5 or 3-3-5 structure. The rise since June might qualify as the central three-wave element of that, making it wave (b) of [iv].
Is upward wave (b) finished yet? Is Bitcoin (BTC) on the verge of a reversal? It might be, although we would prefer to see it overcome resistance at 50191 and test higher resistance, perhaps at 56477. The recent upward leg from late July would look more satisfying with another small down-up sequence. Bulls might have a little more time left to run, but they should start watching carefully.
If there is going to be another small down-up sequence during the next few weeks, traders should watch supports at 45349 and 42670 as areas where BTC could form a base for a relatively small rally.
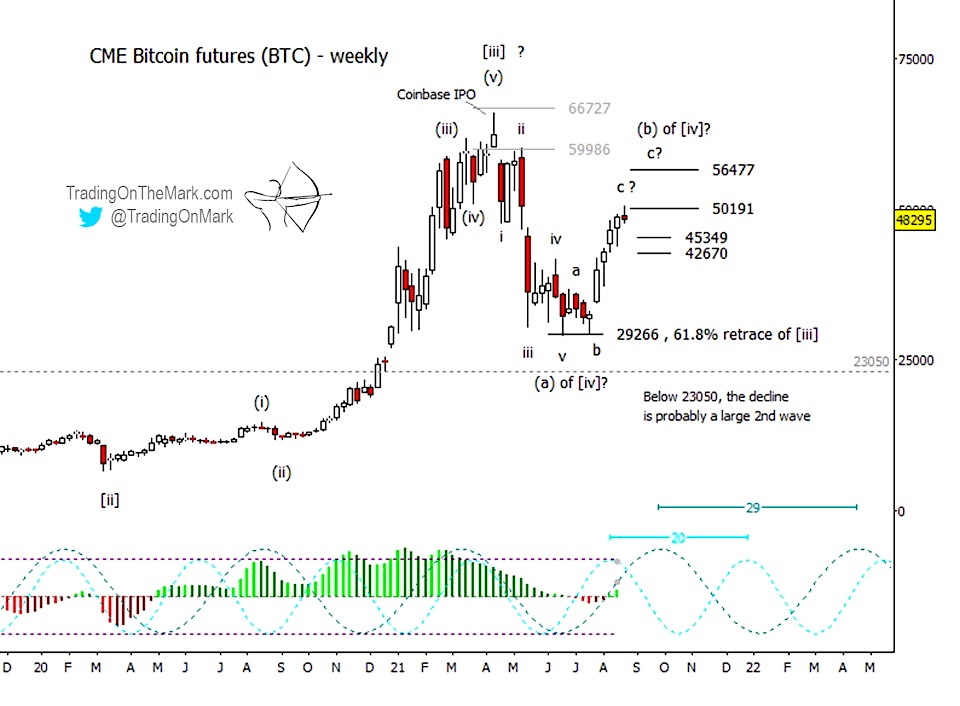
As we implied above, the entire structure since the April high doesn’t yet look like a complete wave [iv]. The preceding wave [ii] lasted approximately two years, and a fourth wave should be proportional to that in terms of time.
Also with regard to timing, we see the prominent 20-week cycle is currently coming off its ideal crest while the 29-week cycle is approaching its own crest. This suggests Bitcoin will soon enter a period of downward pressure that could extend into 2022. Although we don’t believe a decline from the current area is certain, bulls will be fighting against the cyclical tendency at least until October 2021 and perhaps longer.
If a meaningful decline kicks in this summer or autumn, the market will be faced with a choice as BTC approaches the 23050 price area. Below that level would endanger the prospects of the correction being a fourth wave, although there can still be a longer-term bullish trade out of any low that forms sometime between late 2021 and 2023.
Trading On The Mark provides detailed, nuanced analysis for a wide range of markets including crude oil, the S&P 500, currencies, gold, and treasuries. Sign up for free market updates via our page on Substack and follow us on Twitter for more charts.
Twitter: @TradingOnMark
The authors may have a position in the mentioned securities at the time of publication. Any opinions expressed herein are solely those of the author, and do not in any way represent the views or opinions of any other person or entity.
: Creating Bullish Divergence?")

 and Semiconductors (SMH): Concerning Price Pattern?")
 and Semiconductors (SMH): Concerning Price Pattern?")


