When we last wrote about XBI, the S&P Biotech Sector Fund ETF, we noted that it appeared ready for a countertrend rally. In the days that followed, its share price came very close to our upper target of $55.47, representing an increase of more than 20 percent.
Now it is time to consider what may happen during the next swing. This post outlines the two most prominent scenarios, both of which should begin with a downward move in this Biotech Sector ETF. And this should put some near-term pressure on select biotech stocks.
After the all-time high in XBI, the declining pattern that began in July 2015 should be corrective in form. However, corrections can begin either with three-wave moves or with five-wave moves, and it is too early to know with certainty which is taking place for this biotech sector fund. In both of the XBI charts below, we have labeled the first large downward segment of the correction as [a]. Comparison of the two scenarios shows where the safer trades might occur in coming weeks.
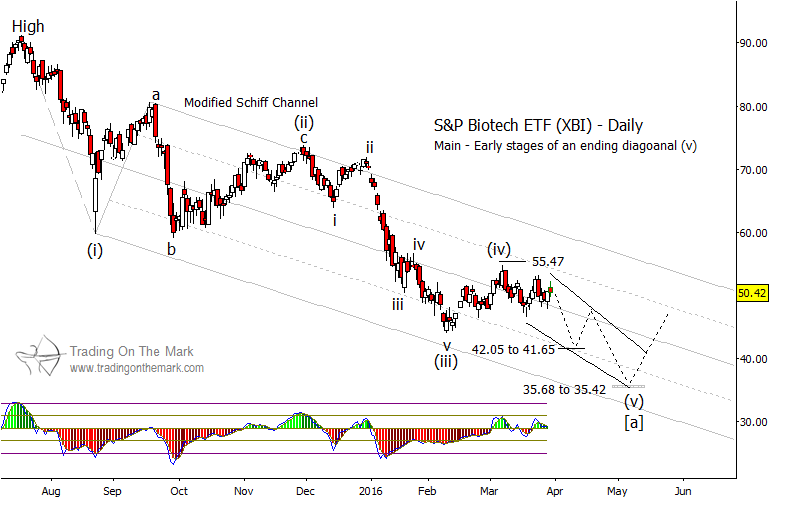
In the first scenario, the decline from last year has farther to go. Treating large wave [a] as having five sub-waves – labeled (i)-(ii)-(iii)-(iv)-(v) – price would currently be in the early stages of sub-wave (v), which itself should consist of five smaller waves. In this view, wave [a] might find completion near the time when our other cycle projections (not shown) suggest there may be a low in broader stock markets.
If one were trading downward, the first area to watch for potential support and a trade exit would be near $41.65 to $42.05. A decline from the present level into that area would probably represent the middle third wave inside downward wave (v). Another downward trade might be possible later, but it would carry more risk due to the uncertainty about which of our two scenarios is playing out.
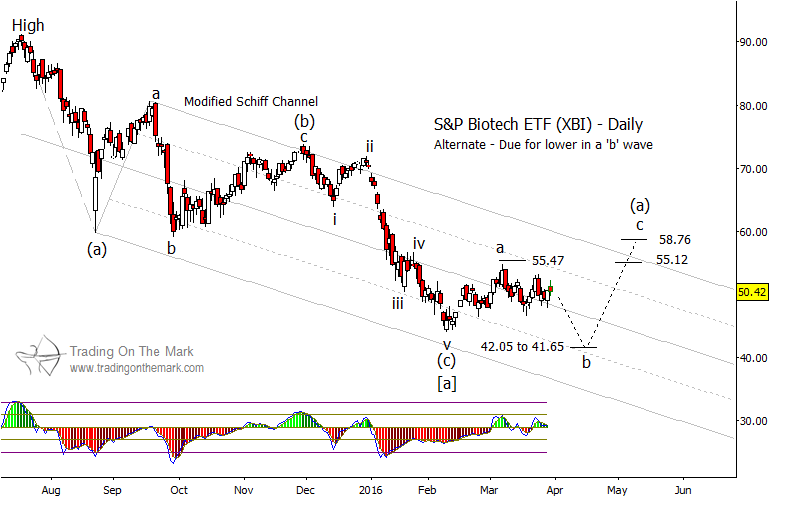
The second scenario for this biotech sector fund considers the path if large wave [a] is comprised of three sub-waves instead of five. In that case, wave [a] may have completed in February. In that case, a downward wave ‘b’ of the next corrective stage of the pattern could manifest during the next few weeks, but it would not be followed by a continuation move. As with our first scenario for XBI, the main area to watch for support is near $41.65 to $42.05.
Finding good entries for upward trades later this year might be tricky. However, by watching price action near the support areas of each scenario, it should be possible to recognize the start of the next significant bounce and to place stops accordingly. If larger equity markets appear weak in late April and early May, that would increase the probability that XBI might test the lower support area shown on our first chart.
Our April newsletter will offer forecasts for gold and silver markets. Click here to request your copy!
Further Reading: “Are US Treasury Bonds Nearing A Trend Change?“
Twitter: @TradingOnMark
No position in any of the mentioned securities at the time of publication. Any opinions expressed herein are solely those of the author, and do not in any way represent the views or opinions of any other person or entity.


