This spring represents an unusual time for interest rates and US treasury bonds. In this post, we examine a recent phenomenon in the yield rate for 30-year US treasury bonds, and we highlight some opportunities in the ETF that follows long-term treasury bonds.
Treasury Bonds Trend Change? Here’s What To Look For
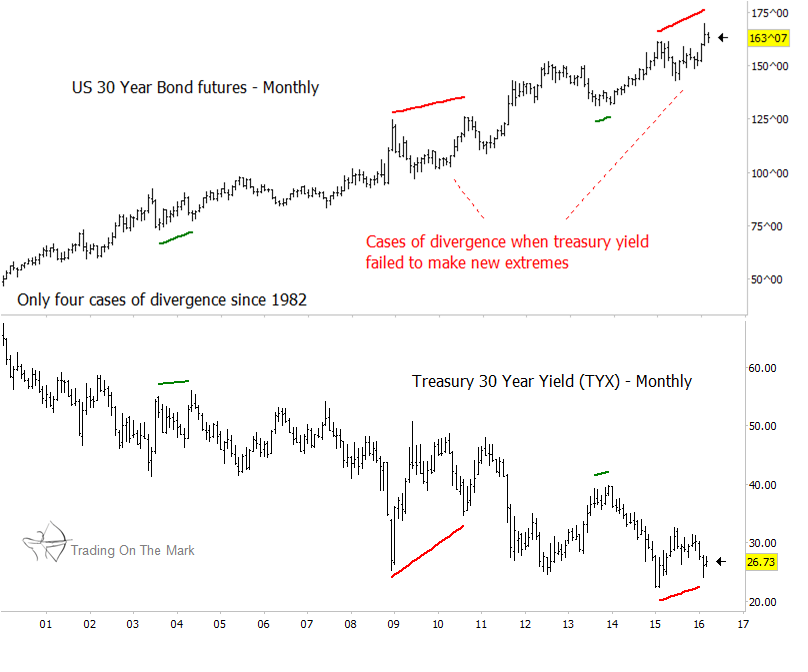
The monthly chart below emphasizes two very simple reasons why now is not the time to be in long positions in treasuries. First, betting that bond prices can go higher is essentially playing a game of chicken with the Federal Reserve by betting that yields can go lower during the next few months. The Federal Reserve has already stated that it will raise the federal funds rate in two stages during the remainder of 2016.
Taking long positions relative to bonds is betting that the Federal Reserve will wait until relatively late in the year to act – something we believe is unlikely.
Second, we note that February presented a rare instance of divergence between the 30-year treasury yield rate (the TYX index) and 30-year bond futures. There have been only four cases of divergence on a monthly chart during the last 35 years, and the current instance is the most exaggerated of those.
All cases of divergence were followed by at least a short-term trend change in bond prices. (Since bond prices and yields generally go in opposite directions, divergence in this context means seeing higher highs on one chart and higher lows on the other.)
Our longer-term charts show 30-year treasuries as being near the completion of a topping pattern – one that would cap the entire rise from 2007. While we do not believe bond prices will crash, it appears likely that a trend change is nearing.
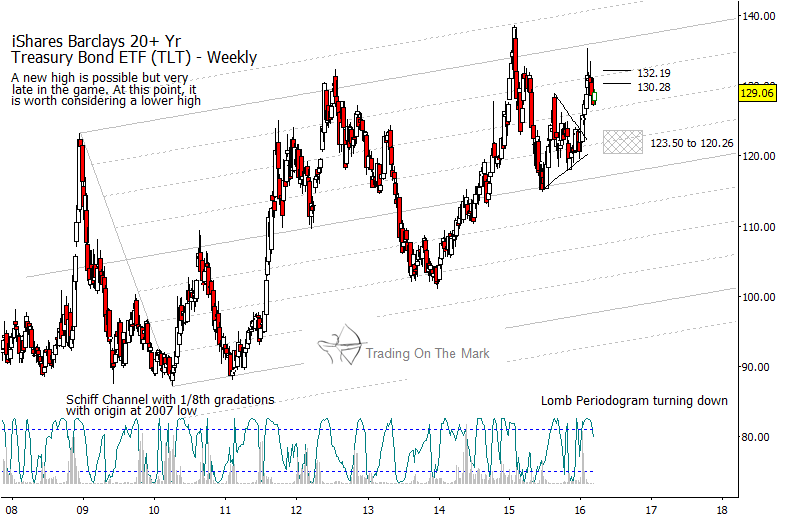
The chart below shows how the next downward swing in bond futures could play out for the iShares Barclays 20+ Year Treasury Bond ETF (symbol TLT). The fund made a lower high recently that coincided with the higher (and possibly terminal) high in bond futures. Looking forward, we would expect TLT to attempt a small upward retracement to approach one of the areas defined by the resistance at 130.28 and 132.19. After that, our forecast suggests that price should decline toward the target zone of 120.26 to 123.50 later in 2016.
Our March newsletter explores opportunities with the long bond in more detail, with finer targets on lower time frames. It also examines the relationship with yield rates and one of the premier bond ETFs. Click here to request your copy!
More from Trading On The Mark: Gold Forecast: Choppy But Higher Into 2021
Twitter: @TradingOnMark
No position in any of the mentioned securities at the time of publication. Any opinions expressed herein are solely those of the author, and do not in any way represent the views or opinions of any other person or entity.


 Flirting With Critical Support… Again")


