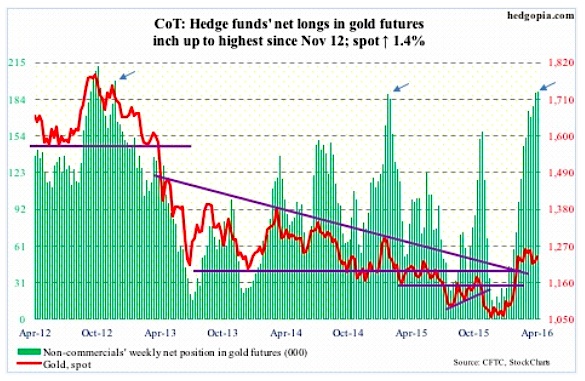
Gold: Gold bugs are not giving up easy.
Faced with a descending triangle formation on spot gold, the horizontal line of which lies at $1200-plus, they are fighting tooth and nail to nullify the bearish signal. So far, they have succeeded. If the pattern is complete, gold could be headed toward below its 200-day moving average ($1141). By that time, it would have not only lost its 50-day moving average but also six-plus year support at $1180.
Assuming the descending triangle is nullified, the next task gold bugs face is breaking out of the range gold is in.
The metal has been in a sideways pattern since it spiked 4.1 percent on February 11th. (That was when U.S. stocks bottomed.)
Here is the risk: Non-commercials’ net longs were 190,400 this week – comparable to holdings as of January 27, 2015 and November 27, 2012 (arrows in the chart). Both these dates marked major peaks – in both net longs and spot gold.
April 8 COT Report Data: Currently net long 190.4k, up 594.
CURRENCIES
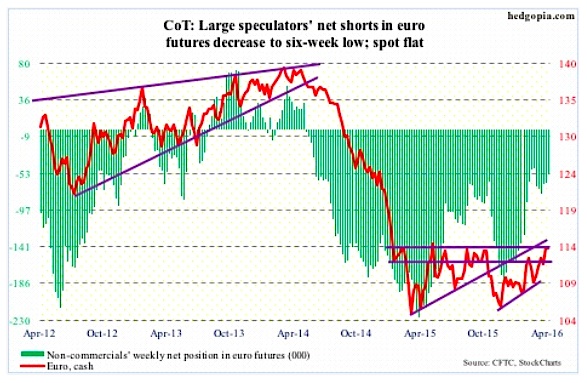
Euro: Since November last year, the euro has rallied eight-plus percent, and is once again knocking on resistance at 114.50, which goes back to January last year.
In the process, weekly momentum indicators are now in overbought territory. On a daily chart, signs of fatigue are appearing, with the currency hugging the 114 range the past seven sessions.
At least near term, the path of least resistance is down. This is technical in nature, not much to do with fundamentals. The latter has been a source of confusion, anyway. On March 10th, the European Central Bank announced uber-dovish stimulus measures, and the currency rallied 1.6 percent in that session, and another 2.3 percent since – for sure not what Mario Draghi, ECB president, was probably hoping for.
April 8 COT Report Data: Currently net short 53.5k, down 10.3k.
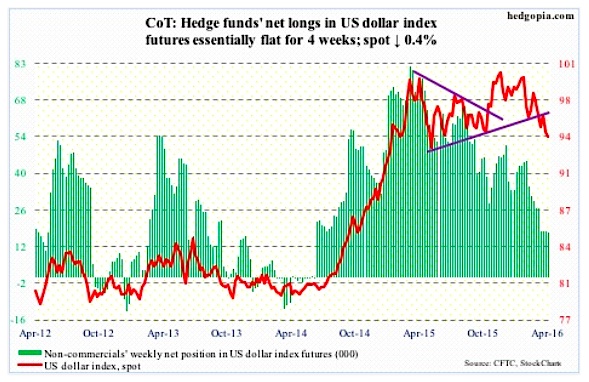
US Dollar Index: From December 3rd intra-day high through the low this Thursday, the dollar index lost 6.5 percent. Both daily and weekly momentum indicators are oversold.
Signs of exhaustion are also showing up on a daily chart, with the index having produced several doji sessions the past several sessions. It is itching to move higher. The question is of duration.
Overhead resistance is strong – particularly around 97, which is where the 200-day moving average lies as well (97.07). The 50-day moving average (96.52) continues to drop.
It just feels like non-commercials are patiently waiting before making a big decision. Net longs have gone flat the past four weeks.
April 8 COT Report Data: Currently net long 17.3k, down 435.
Thanks for reading.
Twitter: @hedgopia
Read more from Paban on his blog.
The author may hold positions in mentioned securities at the time of publication. Any opinions expressed herein are solely those of the author, and do not in any way represent the views or opinions of any other person or entity.


