The following is a recap of the April 8 COT Report (Commitment Of Traders) released by the CFTC (Commodity Futures Trading Commission) looking at COT report data and futures positions of non-commercial holdings as of April 5. Note that the change in COT report data is week-over-week.
Macro Commentary & Economic Releases
The FOMC minutes for the March 15-16 meeting were released this week, and there was nothing substantially new.
That said, maybe because FOMC minutes tend to deal with issues at length, this one comes across as a little bit more dovish than the post-FOMC statement (released on March 16th.)
At the same time, they were not as uber-dovish as Janet Yellen’s, Federal Reserve chair, speech last Tuesday at the Economic Club of New York.
Either way, markets got confirmation that the Federal Reserve’s message has shifted from hawkish to dovish.
Nonetheless, non-commercials raised net shorts to a 22-week high. Rates do seem to want to go higher for now.
Here’s a rundown of economic releases:
The NFIB optimism index for March comes out on Tuesday. February was 92.9, down a point month-over-month, and down from cycle high 100.3 in December 2014. Small businesses’ capex plans in February were 23, down from cycle high 29 in August 2014. Similarly, comp plans were 12 in February, down from 21 in December last year.
Wednesday brings PPI-FD and retail sales (both for March).
Producer prices fell 0.2 percent in February. In the 12 months through February, the PPI was unchanged. Core PPI rose 0.1 percent, and was up 0.9 percent in the 12 months through February.
February retail sales fell 0.2 percent m/m to a seasonally adjusted annual rate of $447.3 billion. On an annual basis, they rose 3.1 percent – the largest increase since 3.9 percent in January last year.
The CPI for March is published on Thursday. Consumer prices fell 0.2 percent in February. In the 12 months through February, they rose one percent. Core CPI was up 0.3 percent. On an annual basis, they increased 2.3 percent – fourth straight two-percent plus reading.
On Friday, we get industrial production (March), the University of Michigan’s consumer sentiment (preliminary April), and the Treasury International Capital (February).
On an annual basis, industrial production has dropped for four straight months. Capacity utilization was 76.7 percent in February, down year-over-year for 10 consecutive months. Utilization peaked at 79 percent in November 2014.
Consumer sentiment fell seven-tenths of a point in March to 91. The cycle high was reached in January 2015 at 98.1.
Foreigners have not been showing love for U.S. stocks. On a 12-month rolling total basis, they sold $127 billion worth of stocks in January – a record.
Six Federal Reserve (FOMC) members are scheduled to speak during weekdays.
APRIL 8 COT REPORT DATA & ANALYSIS:
EQUITIES
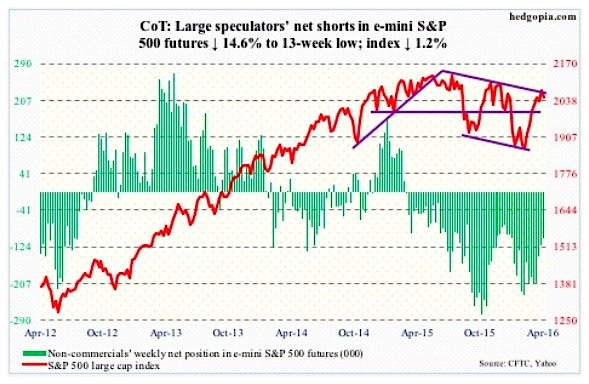
E-mini S&P 500: For the first time since February 24th, the index this Thursday fell below its 20-day moving average, albeit only slightly. The 10-day moving average is flat. Momentum is weakening, with a fresh daily bearish MACD crossover.
The S&P 500 Index fell 1.2 percent for the week, retreating from a declining trend line from last July.
As the 1Q15 earnings season begins, buybacks – for now – no longer act as a tailwind. This, even as inflows have been a persistent problem.
The current stock market rally started on February 11th. Since the week ended February 10th, $7.3 billion has left U.S.-based equity funds (courtesy of Lipper). In the latest week ended Wednesday, $3.2 billion came into these funds, but the last time there were two straight weeks of inflows was in early November last year.
Here is another perspective. To many investors, on March 16th, at the end of a two-day FOMC meeting, the Federal Reserve apparently gave an “all-clear” signal to stocks when it switched from hawkish to dovish message. Is retail buying this? At least not yet. U.S.-based equity funds attracted a mere $500 million since March 16th.
That said, in the week ended Wednesday, SPY, the SPDR S&P 500 ETF, attracted $1 billion, with a combined $3.5 billion on Monday and Tuesday (courtesy of ETF.com). These funds are now in the red.
April 8 COT Report Data: Currently net short 104.2k, down 17.9k.
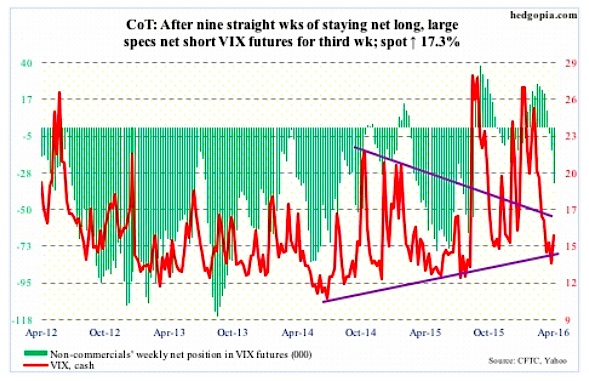
VIX Volatility Index: On April 1st, spot VIX Volatility Index had a daily bullish MACD crossover. VIX is higher since then, but progress has been spotty. A 10/20 (daily moving average) crossover is still possible, as VIX went sideways in the 13-14 region for nearly three weeks.
On a weekly basis, VIX – overbought – still has tons of unwinding left to do. It retreated from Thursday’s high of 16.77, but at the same time found support at its 20-day moving average on Friday. There were two daily dojis in the week.
Three weeks ago, the VIX-to-VXV ratio dropped to 0.782 – a one-year low – and has started moving up, but has ways to go before making it to overbought zone.
April 8 COT Report Data: Currently net short 34.2k, up 20.5k.
COMMODITIES
Crude Oil: Fortunes flipped, so to speak.
For the week ended last Friday, crude oil stocks fell in the U.S., while gasoline and distillate stocks rose.
For the first time in eight weeks, crude oil inventory declined – by 4.9 million barrels to 529.9 million barrels. The prior week was the highest since the all-time high in 1929. In the past 13 weeks, stocks have gone up by 47.6 million barrels.
In the meantime, gasoline stocks rose by 1.4 million barrels to 244 million barrels. Prior to this, stocks declined by 16.1 million barrels in six weeks. Similarly, distillate stocks increased by 1.8 million barrels to 163 million barrels.
Crude oil production, too, fell by 14,000 barrels per day to nine million barrels per day. Production reached a record 9.61 mb/d in the June 5th (2015) week.
Crude oil imports continued to fall, this time by 494 kb/d to 7.3 mb/d. In the past couple of weeks, imports have fallen by 1.1 mbpd, but from a high level.
Lastly, refinery utilization rose by a point to 91.4. Utilization has increased 5.3 points in the past eight weeks.
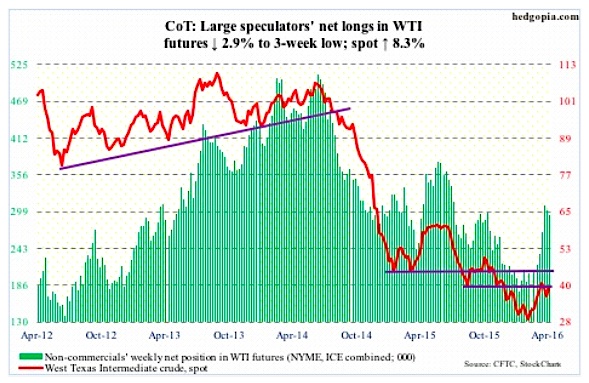
As stated last week, support at $34.50-$35 was a line in the sand. It held this week, with an increase in volume. There is room to rally on a daily chart.
The only potential problem is the U.S. dollar. The U.S. dollar index is itching to rally – at least near term.
April 8 COT Report Data: Currently net long 293.3k, down 8.7k.
continue reading on the next page…
: Creating Bullish Divergence?")


 and Semiconductors (SMH): Concerning Price Pattern?")


