2020 by most accounts is a year most people will be happy to turn the page on. This also likely includes the United States Department of Agriculture. And corn observers, traders, and analysts.
It was not a banner year for the USDA when it came to the assessing the accuracy of several of their key Corn acreage and stocks reports throughout the 2020 U.S. spring and summer growing season.
Below is a compilation of the USDA’s “greatest misses” for 2020, including the eventual impact and volatility their miscalculations had on corn prices and the makeup of the current U.S. corn S&D:
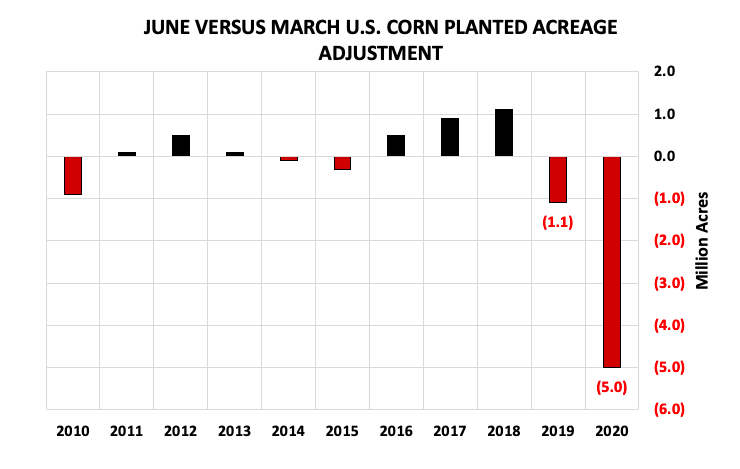
1. March 31st Prospective Plantings Report: On March 31st, 2020 in the March Prospective Plantings report the USDA issued a 2020/21 U.S. corn planted acreage forecast of 97.0 million acres. In June the USDA lowered that figure by a record 5 million acres; despite 2020 representing one of the fastest and most benign spring planting campaigns in the last 20-years. In fact as of the second week of May, 67% of the U.S. corn crop had already been seeded compared to just 28% in 2019.
Furthermore in 2019, which featured record prevent plant U.S. corn acres of 11.4 million following historic spring flooding in the Midwest, the USDA only reduced U.S. corn planted acreage -1.1 million acres (March versus June). Therefore by the numbers…the USDA’s harvested acreage decline since May, which is now -7.1 million acres, has resulted in total U.S. corn production falling 1.250 billion bushels. This is irrespective of the national yield decline, May versus December, of -2.7 bpa (178.5 bpa versus current 175.8 bpa).
2. Sep 1 Corn Stocks: On September 30th, 2020 the USDA estimated September 1 corn stocks at 1.995 billion bushels, 255 million bushels BELOW the average trade guess. This represented the second largest shortfall, actual stocks versus trade guess, in 13 years. And it was largely a function of the USDA revising their June 1 corn stocks figure in the September report (down 205 million bushels), which is virtually unprecedented.
What was the impact on the U.S. corn balance sheet? Sharply lower September 1 corn stocks resulted in 2020/21 U.S. corn carryin stocks being lowered to 1.995 billion bushels in the October 2020 WASDE report versus 2.253 billion bushels the prior month. Furthermore, it was the 2nd consecutive year the USDA made more than a -250 million bushel adjustment to “old-crop” U.S. corn ending stocks during the final month of the crop year, indicating (although they refuse to admit it) for two years running they have now grossly over-estimated the size of the U.S. corn crop. The USDA’s preferred explanation for lower corn stocks has been and will likely continue to be “disappearance.”
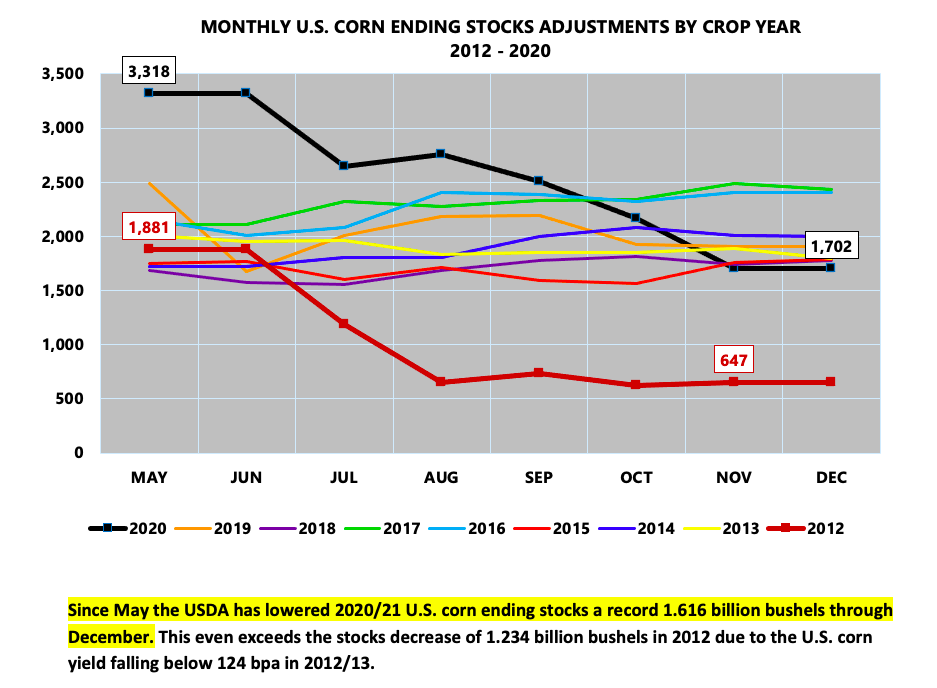
3. That said for all the continued focus on China and a resurgence in U.S. corn export business to the PRC, the reality is total 2020/21 U.S. corn demand is up just 25 million bushels net since the USDA’s initial usage forecast of 14.800 billion bushels in the May 2020 WASDE report. The increase in U.S. corn exports has largely been negated by near equal combined decreases to Feed & Residual Use and Corn-Ethanol Demand. Therefore the notion that this has been a demand led rally in corn futures, is more myth than fact. The truth is the USDA’s seismic supply-side decreases to planted/harvested acreage and carryin stocks have effectively trimmed U.S. corn ending stocks by more than 1.200 billion bushels over the last 9-months.
My sincere hope is the USDA will reassess the process by which they are collecting acreage and quarterly stocks figures and improve it. Thus far hedgers and producers are bearing the brunt of the USDA’s ineptitude based on the market pricing in a U.S. corn ending stocks figure of 3.300 – 3.400 billion bushels in May-June, only to learn its now 1.702 billion bushels (again with 1.200 billion bushels of that decrease having nothing to do with yield losses, summer weather/derecho, and/or record Chinese corn imports). March corn futures have correspondingly now rallied more than $1.00 per bushel (approximately +25%) since June 2020. And while higher prices are certainly a welcomed feature for 2021, hedgers and producers would still greatly appreciate some measure of confidence in the USDA’s acreage and stocks estimates in the new calendar year.
Twitter: @MarcusLudtke
Author hedges corn futures and may have a position at the time of publication. Any opinions expressed herein are solely those of the author, and do not in any way represent the views or opinions of any other person or entity.

: Worrisome to Broader Market?")

