If you saw our recent post charting the leading U.S. Dollar ETF (NYSEARCA:UUP), you know we expect the Dollar to resume its advance soon. In conjunction with a Dollar rally, readers here should be able to find some good short setups with paired currencies.
In fact, we believe monitoring the Dollar Index gives our subscribers a special edge in trading the Euro currency futures (CURRENCY:EUR) and related products.
When we last wrote about a Euro-related ETF (NYSEARCA:FXE) in November, we showed some nearby support levels that we expected to break. The weeks after our post saw a small decline beneath support, but price then climbed back above the first support level. That should have prompted any short traders to reassess the trade or to allow the trade to be stopped out.
A medium-sized decline still appears to be in store, and we might now see the Euro try to push down from its present area, which is near resistance on monthly and weekly time frames. The monthly chart for Euro futures, below, shows the approximate magnitude of the move we expect.
Admittedly the Elliott wave pattern is not clear. Our primary scenario has a five-wave structure taking price down from the early 2014 high – down from the point marked as (e) of [b]. In that view, wave ‘ii’ of the five-wave decline was small enough not to stand out on a monthly chart. The prolonged consolidation that lasted through 2015 and part of 2016 was probably wave ‘iv’ of the sequence. From there, we are watching for the completion of downward wave ‘v’, which itself should consist of five sub-waves.
In this case, one of the limitations of this type of technical analysis is that we cannot be certain where the sideways wave ‘iv’ actually ended and the downward wave ‘v’ began. The change might have happened at either one of the two times when price intersected the gray downward-sloping trend line shown on the chart. However, one of the benefits of this type of pattern analysis is that it forecasts the strong possibility of at least one more medium-sized decline, and possibly two such declines.
Euro Currency Futures “Monthly” Chart – Decline Coming?
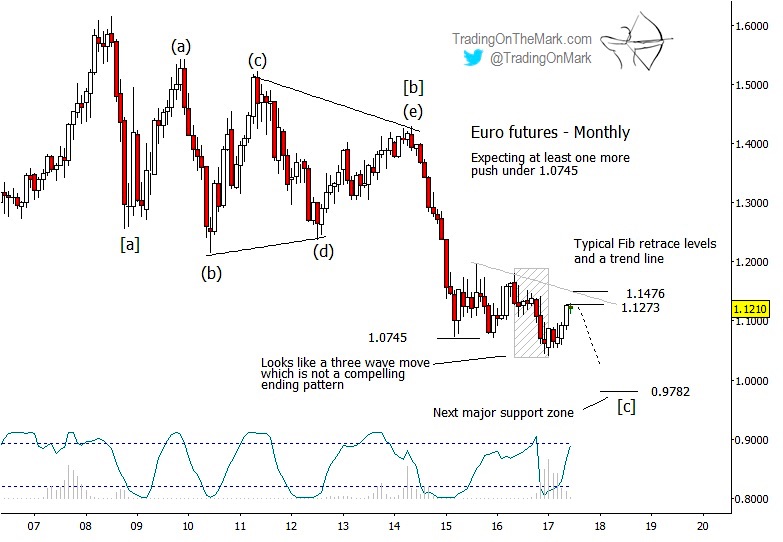
On a monthly time frame, the main resistance area to watch for a downturn is between 1.1273 and 1.1476 for continuous-contract futures. If the decline begins from that area, then the most prominent downward target should be near 0.9782. Conceivably price could reach for that area in one declining move or through a sequential pair of declining moves.
There are some interesting resistance targets to watch on a weekly futures chart too, as well as on the chart for FXE, the CurrencyShares Euro ETF. We plan to include both of those charts in our upcoming email bulletin. If you don’t already receive our bulletins, you can request your copy at our website.
Twitter: @TradingOnMark
No position in any of the mentioned securities at the time of publication. Any opinions expressed herein are solely those of the author, and do not in any way represent the views or opinions of any other person or entity.


 Nears Important Pivot Point")

