It’s time for another set of macro technical charts to watch as we prepare for the month of February (including stock market indices, sectors, individual commodities, currencies, bonds, and other benchmarks and market indicators).
This chart review will include 5 charts and look at key technical price developments. Even if you’re not technical analysis minded, I believe that it’s a useful way to stay on top of global market trends across the major financial markets. You can also use this chart analysis as a prompt for further analysis and investigation…
In this edition we look at range compression in Crude Oil, a bull flag setup on the Russell 2000 (INDEXRUSSELL:RUT), a key test for Emerging Markets (NYSEARCA:EEM), a symmetrical triangle formation in Biotech (NYSEARCA:XBI), and a bottom in Turkish Equities (NYSEARCA:TUR).
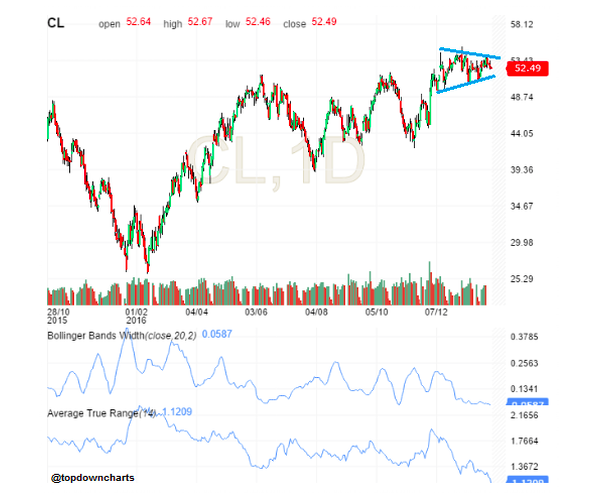
Crude Oil – Range compression
WTI crude oil is trading in a small symmetrical triangle formation. Range compression can be seen in the squeeze in Bollinger Band Width and Average True Range to the lowest point than since the oil crash started.
This could be described as “coiling” and getting ready for a large move… the old saying “low volatility is often a good predictor of future higher volatility”.
Overall technical view: WTI crude oil is undergoing range compression and a big move is likely soon
NEXT CHART (Russell 2000 bull flag)…
")


")
