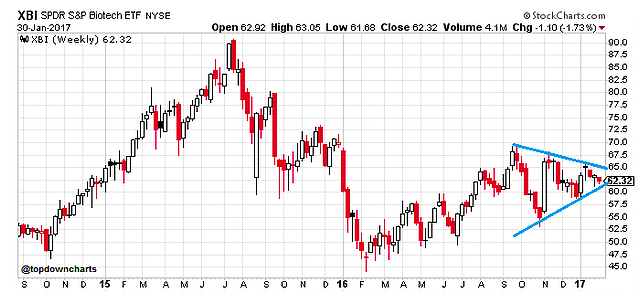
Biotech – Symmetrical Triangle
A symmetrical triangle has developed on the weekly chart for Biotech (XBI). This chart pattern can function as a reversal or continuation; go with the breakout. On the daily chart, price is still comfortably above the 200 day moving average but chopping around the 50; a break of the 200 would help with confirmation of any downside breakout from the triangle.
Overall technical view: Neutral, wait for a breakout
NEXT CHART (Turkey ETF)…

 Testing Important Price Support")
: Cup (and Maybe Handle) Watch")

