Today’s excerpt from my broader research highlights key technical trading developments and themes across the broader financial markets that are worth watching. Some have been on my radar for some time. There are 6 of them.
1) The S&P 500 Index and NASDAQ Composite are both trading at similar levels as last week, and require more to expect either an upside breakout (or breakdown) to get underway. A pullback to new three-day lows is necessary to expect immediate downside follow-through.
2) Natural Gas price breakout might be worth following in 2021 as cycles show steady upward bias into the Spring.
3) The Value Line Geometric Average is up near all-time highs directly explains the degree of lagging in recent days. Value Line, the broadest based Equal-weighted index of US Stocks, has just reached 2018 peaks, while EZU, FEZ are close along with TOPIX, DAX, and EEM not to mention indices like ILF reaching trendline resistance
4) The US Dollar breakout hit highs off its daily Bollinger Band and pulled back Tuesday. But upward progress looks to continue into late January given the improvement in momentum, near-term combined with very bearish Sentiment
5) Defensive underperformance is ongoing and something to watch for when this changes, which typically DOES precede most market peaks
6) Crypto decline has reached 4 straight days before some stabilization Tuesday. While bounces can happen into end of week, momentum and cycles are turning down, and sentiment is quite bullish. Selling into strength should make sense for a Q1 correction.
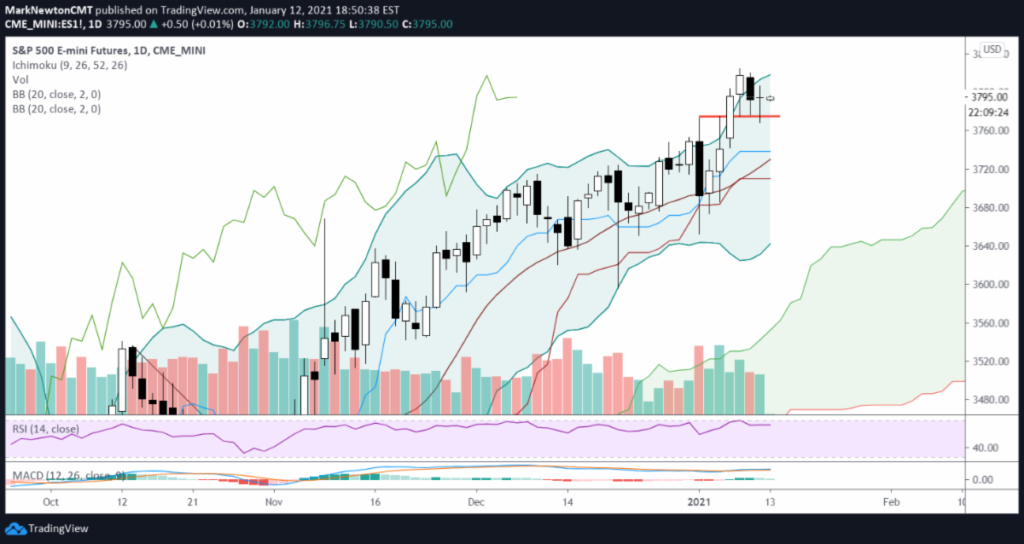
S&P 500 (SPY) Chart Spotlight
The S&P 500 continues to show a broad-based stalling out with prices literally at the same level as mid-last week. UNDER 3775 on a close is important, but I am expecting a final push higher on weak breadthbetween now and end of week which should offer opportunistic traders the chance to sell and or hedge. As with yesterday, we’ll lean on the 3-day pattern to give guidance here for near-term direction.
If you have an interest in seeing timely intra-day market updates on my private twitter feed, please follow @NewtonAdvisors. Also, feel free to send me an email at info@newtonadvisor.com regarding how my Technical work can add alpha to your portfolio management process.
Twitter: @MarkNewtonCMT
Author has positions in mentioned securities at the time of publication. Any opinions expressed herein are solely those of the author, and do not in any way represent the views or opinions of any other person or entity.


")


 Rolling Over At Key Fibonacci Level?")