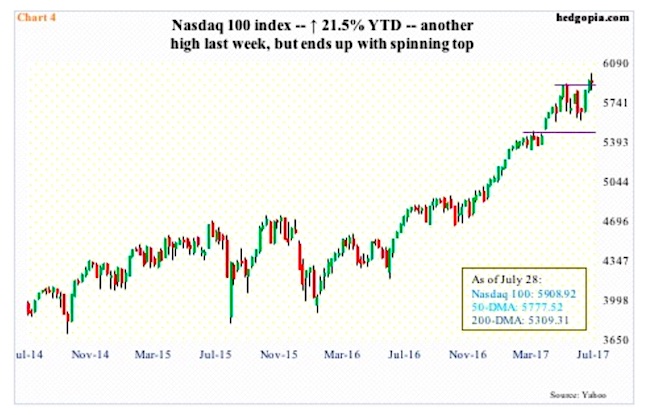
The Nasdaq 100, on the other hand, is leading, thanks in particular to the leading names/weights. Of late, it is also beginning to give out signs of fatigue.
Last Thursday, it rallied to a new intraday high of 5995.77, only to reverse to close down 0.6 percent. The weekly chart produced a spinning top (Chart 4).
Last week, investors/traders reacted negatively to 2Q17 earnings from Alphabet (GOOGL) and Amazon (AMZN). Facebook (FB) rallied but closed poorly – up 2.9 percent versus up six percent at one time. Apple (AAPL) reports tomorrow.
Real test for the bulls is how they react when the 50-day (5778) is tested, which is a stone’s throw away. Three months ago, the Nasdaq 100 broke out of 5450.
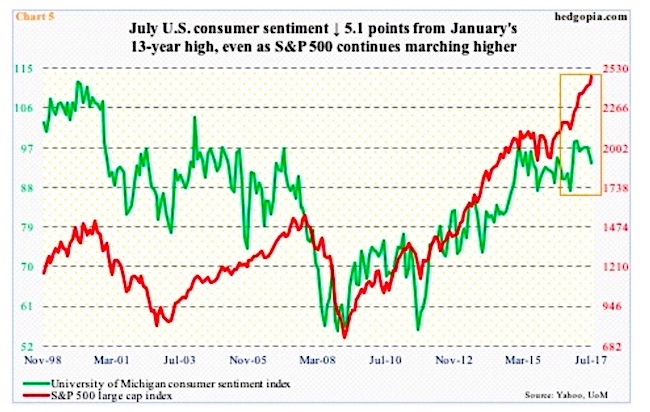
Post-U.S. presidential election last November, all these indices jumped. As did several survey-based metrics such as consumer sentiment. President Trump’s promises to deregulate, cut taxes, and increase infrastructure spending provided the catalyst. Not much progress has been made on this front.
The University of Michigan’s consumer sentiment index read 87.2 last October, then surging to a 13-year high 98.5 in January, before gradually easing off. This month, it fell another 1.7 points month-over-month to 93.4.
Directionally, consumer sentiment tends to go hand in hand with the S&P 500 (Chart 5). Of late, the two have diverged, with the former lagging. A catch-up trade likely lies ahead.
Thanks for reading.
Read more from Paban over at hedgopia.
Twitter: @hedgopia
Author may hold a position in mentioned securities at the time of publication. Any opinions expressed herein are solely those of the author, and do not in any way represent the views or opinions of any other person or entity.


