Amidst 2Q17 earnings and elevated multiples, some signs of fatigue are showing up on major U.S. stock market indices. Is this leg of the stock market rally nearing an end?
As of last Thursday, 2Q17 operating earnings of S&P 500 (INDEXSP:.INX) companies were on course for $30.70. In the year-ago quarter, they were $25.70 and $28.82 in 1Q17.
If realized, 2Q17 will be a record, even through estimates have been coming down. One year ago, the consensus was $32.66. When 2Q17 ended, estimates were $30.97.
For many quarters now, estimates have continued to get cut after a quarter has ended and as companies report results. Since the quarter ended, 2Q17 estimates have gone down by $0.27.
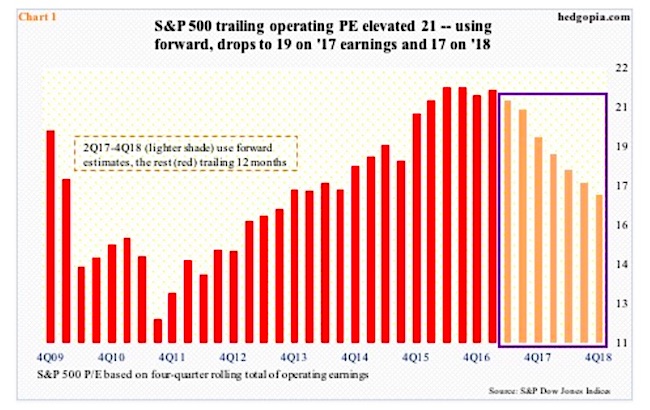
The downward revision trend also holds true with 2017 and 2018, the former in particular. Versus $141.11 in January last year, 2017 estimates currently are $127.51. Similarly, 2018 has come down from $147.21 in January this year to $145.17.
In the meantime, indices continue to post new highs.
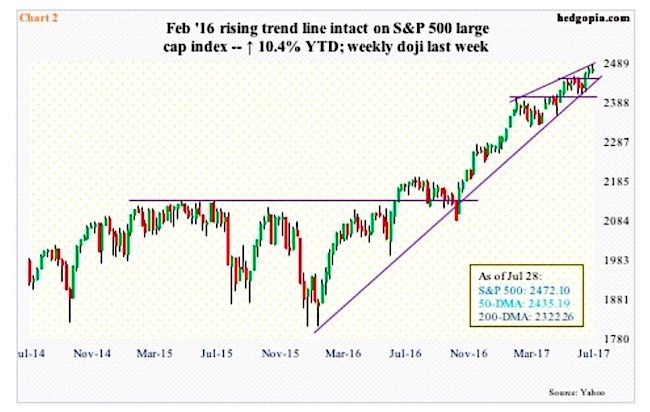
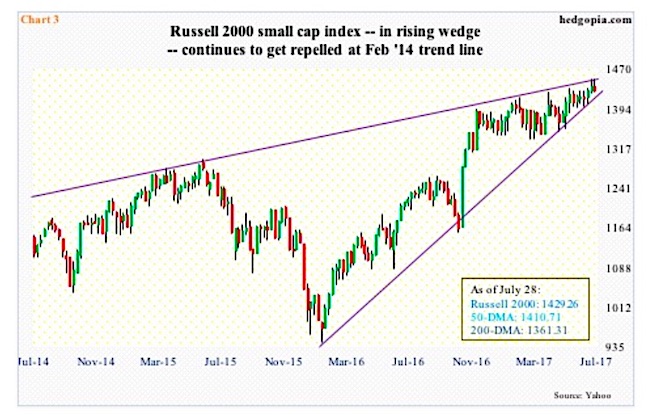
Year-to-date, the S&P 500 large cap index is up 10.4 percent, Dow Industrials 10.5 percent, Nasdaq 100 21.5 percent, and the Russell 2000 small cap index 5.3 percent.
Multiple expansion continues. On trailing 12 months, the S&P 500 trades at 21.3x operating earnings. Using forward estimates, this drops to still-elevated 19.4x 2017 and 17x 2018.
Just because multiples are elevated does not mean they have to reverse. They will expand as long as momentum is intact. Just the nature of things.
That said, because of this, it probably pays to be on the lookout for signs of fatigue. And some are beginning to show up.
Within the Dow family, the Industrials act fine, even as the Transports act horrible. The signal is mixed.
Over on the S&P 500, last week was a doji.
ALSO READ: Is The VIX Setting Up For A Big Move?
The intraday high of 2484.04 last Thursday was a new record, before reversing to close down 0.1 percent. The session produced a hanging man. Friday, it gapped slightly slower.
The index remains overbought on nearly all timeframes. Nearest support lies at 2450, which also approximates the 20-day moving average. A little over two months ago, the S&P 500 broke out of 2400. In the event of a backtest, it would have lost the trend line from February last year.
On the Russell 2000 small cap index (INDEXRUSSELL:RUT), it does not take much to lose the February 2016 trend line (Chart 3). The index is already trapped in a multi-year rising wedge, with the trend line from February 2014 persistently repelling breakout attempts, including the last two weeks.
On the daily chart, the MACD just completed a potentially bearish cross-under. The 50-day lies at 1411. Below that lies important support in 1390s. Prior to breaking out early June this year, the Russell 2000 was range bound between 1340s and 1390s for six months, hence the significance of this level.
Year-to-date, the Russell 2000 has lagged its U.S. peers.
continue this article on the next page…


 Ready To Break Out?")


 Ready To Break Out?")
