The lack of volatility in volatility is once again giving rise to the phrase ‘it is different this time”. If past is any guide, it seldom is.
Spot VIX Volatility Index (INDEXCBOE:VIX) just created a record.
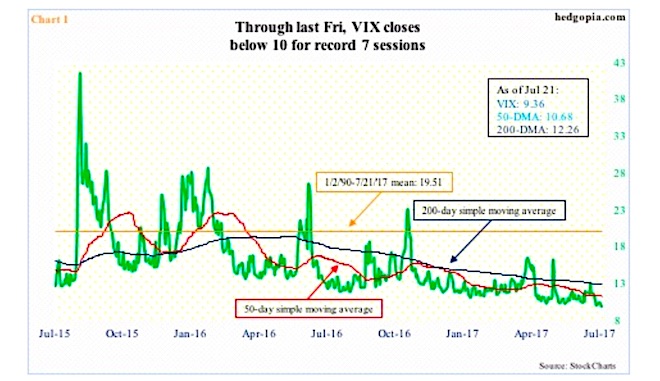
VIX goes back to January 1990. In its 27-year history, it closed below 10 21 times, 12 of which have occurred since May this year, and seven in the past seven sessions.
Talk about volatility suppression!
The last time VIX traded above its historical average of 19.51 was on November 9, the day after U.S. presidential election last year. Except for a few spikes that quickly got unwound, VIX has traded below both 50- and 200-day moving averages for a while now (see chart above).
In fact, volatility suppression is not just recent phenomenon.
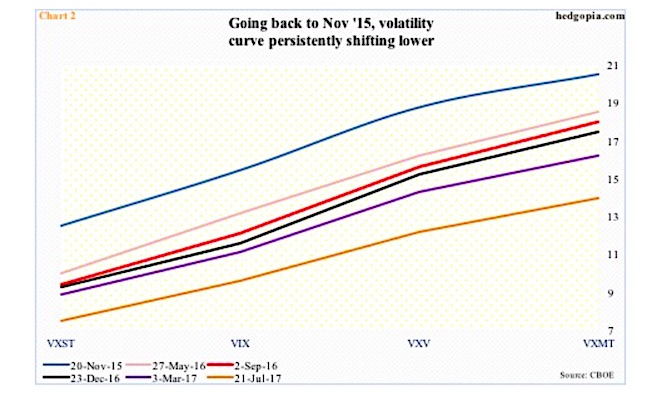
Chart 2 (below) plots six dates going back to November 2015 in which the spread between VXST and VXMT is minus seven or above. (Last Friday was -6.8.)
VXST (INDEXCBOE:VXST) measures S&P 500 volatility for nine days, while VXMT (INDEXCBOE:VXMT) goes out six months. In between lie VIX (30 days) and VXV (three months).
The VXST-VIX-VXV-VXMT curve, in contango, has been persistently shifting lower. The whole curve – not just for nine days but going out six months.
The result is the prevailing ‘it is different this time’ sentiment.
Volatility bears are putting money where their mouth is.
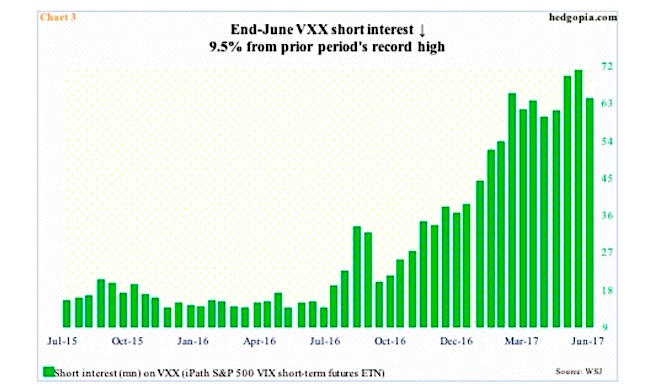
Short interest on the iPath S&P 500 VIX short-term futures ETN (NYSEARCA:VXX) began to lift from a sideways pattern a year ago, followed by a quick parabolic move. It fell 9.5 percent period-over-period at the end of June, but at 70.2 million mid-June was a record (chart 3 below). (Mid-July numbers come out tomorrow.)
Looking at the chart, it looks like a crowded trade, but VXX last Friday closed at an all-time low of 11.20. Going short VXX has been the right strategy thus far.
Over in the futures market, the story is the same.
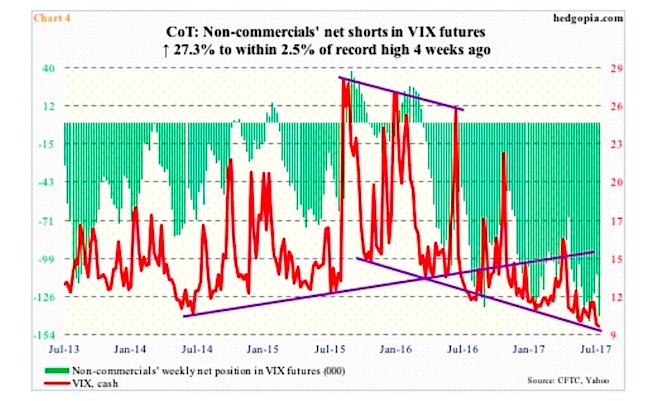
Non-commercials have doggedly stayed short VIX futures since March last year, accumulating the most net shorts a month ago (143,845 contracts). As of Tuesday last week, they were holding 140,368 contracts, just 2.5 percent from the record (chart 4 below).
In the meantime, spot VIX has persistently been making lower lows since October 2015. It closed Friday at 9.36, with an intraday low of 9.30. The all-time low of 8.89 was recorded on December 27, 1993.
Once again, the trade has paid off for non-commercials.
continue reading this article on the next page…


