Stocks are priced for perfection. Bonds trade at historically low yields despite 7% inflation. What could go wrong?
As fiscal and monetary support for the economy and markets wane, valuation extremes are in the crosshairs. While the setup for 2022 is not looking as friendly as 2021, we must realize the environment can change quickly.
For more on the macroeconomic drivers supporting this forecast, please read Part 1 of our 2022 Investment Outlook – Tailwinds Shift To Headwinds.
2022 Investment Outlook for Stocks
Valuations
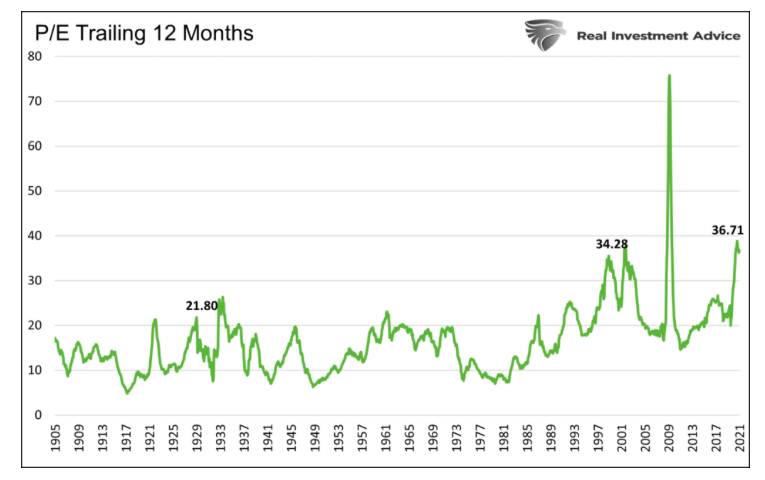
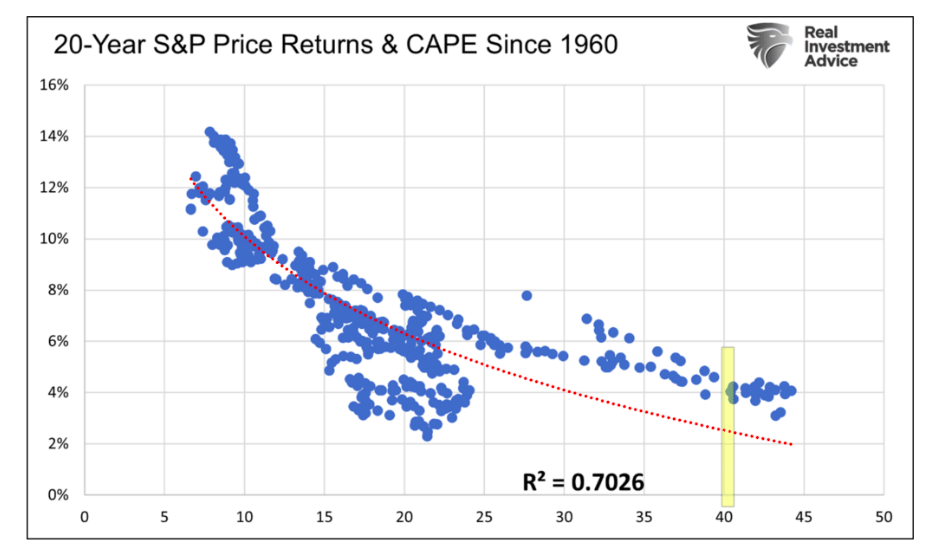
As shown below, as we have highlighted in many articles, valuations are at or near record levels. While nothing limits valuations from rising further, we must consider a reversion to the mean in many cases can result in losses of greater than 40%.
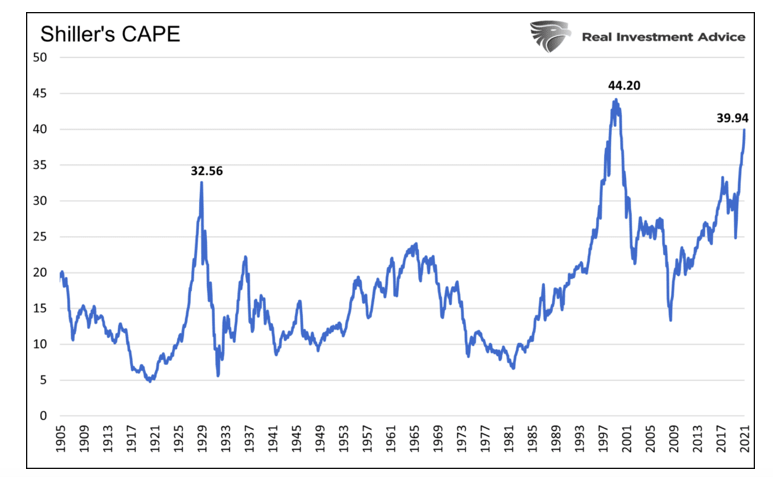
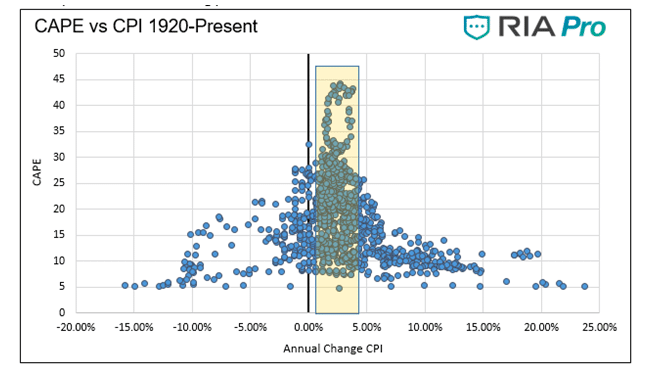
Complicating the valuation story is inflation. The graph below shows that historically periods of low inflation or deflation or inflation running greater than 5% are accompanied by CAPE readings of 25 or less. The current reading is 40.
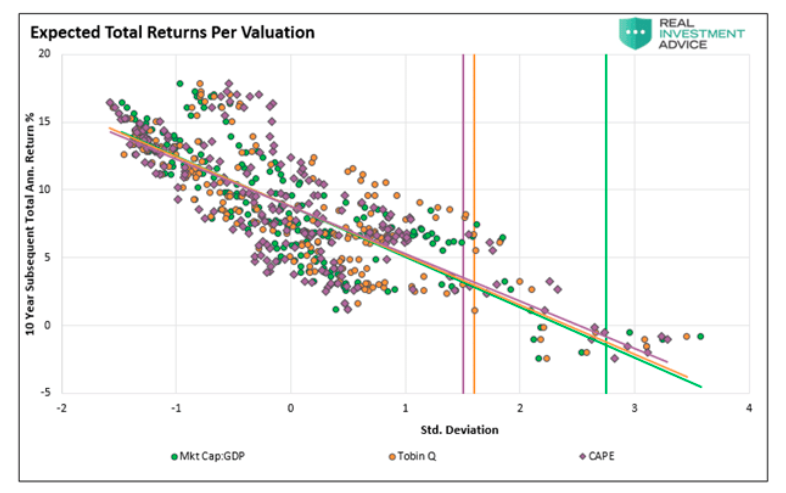
The graph below uses three popular valuation techniques to quantify longer-term future returns. Based on the data, the ten-year outlook is for low single-digit returns at best. The second graph uses CAPE in a similar fashion to show the 20-year outlook is not much better. While our analysis may seem bearish, we reiterate that nothing says valuations cannot continue to stretch further.
Profit Margins
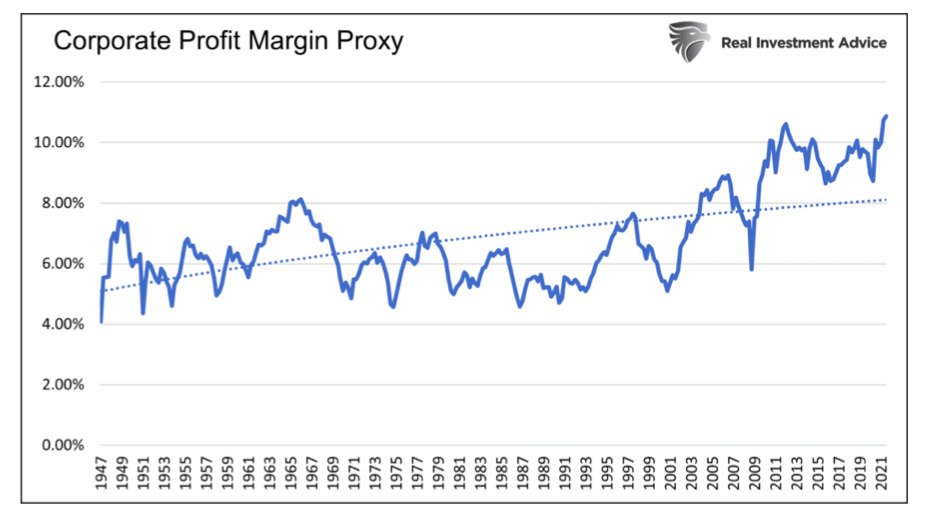
Corporate profit margins rose to record levels in 2021. Many companies were able to push higher costs onto consumers. At the same time, they were the ultimate beneficiaries of excessive government spending.
As we show below, corporate profits as a percentage of GDP are at the peak of the last decade and well above the 60-year trend leading to the financial crisis. A reversion back to the trend line would result in a 3% decline in profit margins. It is worth considering profit margins tend to revert to and through the trend line. A reversion back to the lows of 2009 and 2002 portends a 50% cut into profit margins. With valuations already at extremes, profit weakness would not support lofty expectations.
The Tail Wagging The Dog- Stock Options
This is where the analysis gets tricky. The graph below from Goldman Sachs shows more volume trading in stock options than the underlying stocks. Options are inherently highly leveraged and volatile. As the amount of options grows versus the shares outstanding, options become the tail wagging the dog.
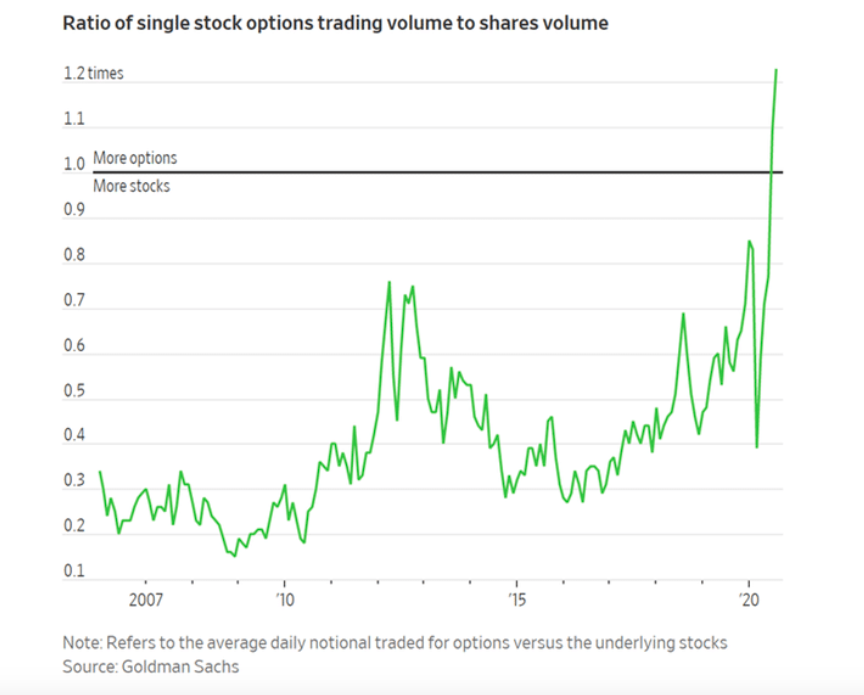
As we learned over the last two years, dealer hedging of options positions can result in great rallies. Conversely, as we watched in the second half of 2021, the options expiration period was not an investor’s best friend.
Forecasting how options trading might affect stock prices is nearly impossible for a 2022 investment outlook. That said, options have and will continue to influence the market significantly.
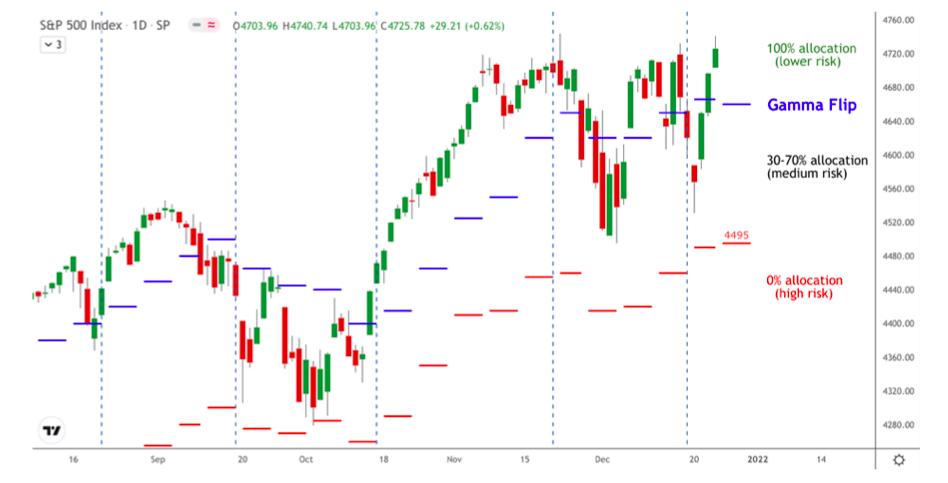
One way to track potential volatility is with Gamma flip levels. Gamma helps us understand how dealers hedge options and react by buying or selling the underlying stocks to maintain hedges. SimpleVisor subscribers receive Viking Analytics weekly Gamma Band Update to help them with this task. The graph below from a recent edition shows recommended allocations based on the Gamma of S&P 500 options.
And now we turn out attention to bonds.
Click to continue on the next page and read our outlook for bonds in 2022.

: Showing Some Signs of Emerging Strength")
