2022 Investment Outlook for Bonds
The outlook for bonds is equally tricky. If you had asked most bond traders a year ago where they thought bond yields would be if inflation approached 7%, most would have said much higher than current levels.
Inflation and Growth Drive Bond Yields
The graph below from Longview Economics show bond yields are abnormally low given the level of inflation. Per the historical relationship between 10-year UST yields and inflation, the 10-year yield should be 4-7%.
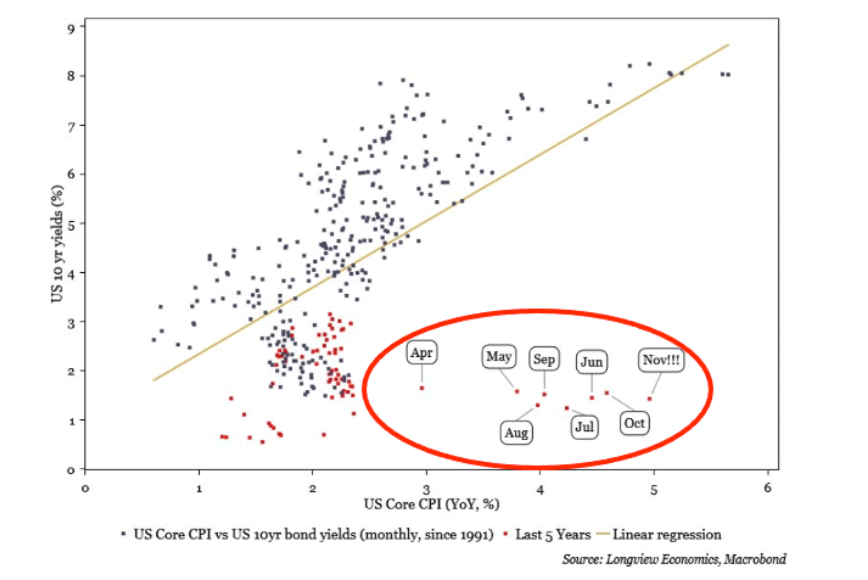
To help explain this anomaly, we must consider that bond traders tend to look at inflation beyond a year or two when determining value. Low expected inflation or deflation helps justify negative real yields today. Currently, TIPs markets imply 2.48% inflation for the next ten years. Bond traders must be confident inflation is transitory. If persistently high inflation becomes more likely, bond yields could rise quickly.
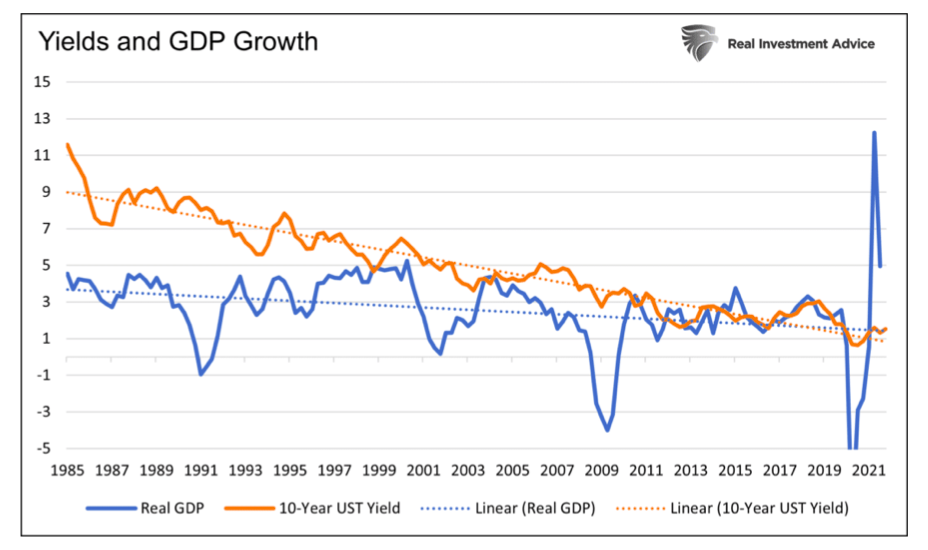
Economic growth over the next ten years is likely to be 2% or lower based on productivity and demographic trends. The Fed’s long-range forecast is 1.6-2.2%. The graph below shows the trends for GDP, and yields have been lower for the last 40 years. Note the declining yield trend is steeper than GDP. Some of this is due to the Fed’s influence on rates.
The Fed
As noted in Part 1 of the 2022 Investment outlook, the Fed has been buying nearly 100% of what the Treasury is issuing. To wit- “the Fed has bought nearly $5 trillion of bonds since the pandemic began. In doing so, it came close to absorbing 100% of the net new debt issuance from the government.”
Banks Are Flush With Cash
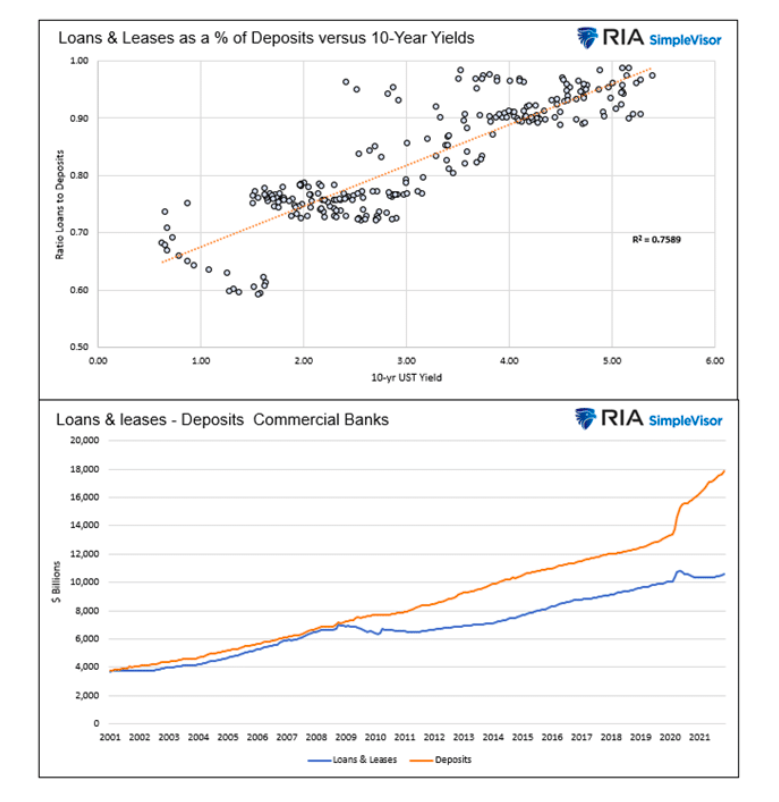
The graphs below help explain a third important factor keeping yields low. The bottom chart shows deposits at commercial banks are growing much faster than banks are lending money. The banks need to invest deposits, and since they are not lending them out, they frequently invest in U.S. Treasury securities. The upper graph shows the statistically strong correlation (R-squared .76) between the ratio of loans and leases to deposits versus ten-year Treasury yields. Unless the banks are going to start significantly ramping up lending, which we doubt, expect current trends to continue, thus supporting low yields.
Lower Yields
We think inflation is in the process of peaking. Shortages and supply line problems are slowly diminishing. At the same time, demand is normalizing, and there is little fiscal stimulus on the horizon to boost demand further. We offer a big disclaimer. The current environment is anything but typical. While we think inflation will ease, we are mindful that factors, such as rising wages may keep it elevated.
Yields have trended lower for the past 30 years, following economic growth. We think those trends continue in the year ahead.
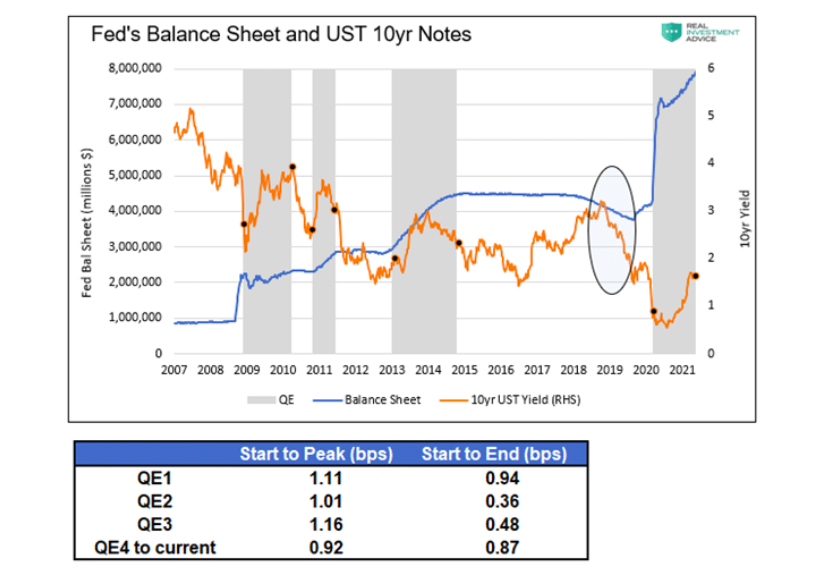
Some will counter that if the Fed is not buying bonds who will? We do not know, but as we conclude in Taper is Coming: Got Bonds?: “Currently, yields are close to their cycle highs. If we believe the Fed is nearing tapering, yields could be peaking. Based on prior QE taper experiences, a yield decline of 1% or even more may be in store for the next six months to a year if the Fed is, in fact, on the doorsteps of tapering.”
The graph below from the article shows yields tend to fall after periods of QE and when they are reducing their balance sheet (QT) as circled. QT is currently being discussed by Fed members per the two headlines below.
- BOSTIC SAYS FED COULD EASILY PULL $1.5 TRILLION OF “EXCESS LIQUIDITY” FROM FINANCIAL SYSTEM, THEN WATCH MARKET REACTION FOR FURTHER BALANCE SHEET REDUCTIONS
- MESTER: ABLE TO LET BAL SHEET TO RUN DOWN FASTER THAN LAST TIME
An ISM Reading That May Make You Rethink Your Stock/Bond Allocations
In a recent daily Commentary we wrote the following. This quick note provides another reason yields may fall in the coming months.
The ISM Manufacturing Index was below expectations at 58.7, an 11-month low. Notably, the prices paid index fell sharply from 82.4 to 68.2, and supplier delivery times fell to a four-month low. The data provide signals that inflationary pressures are fading, at least for the time being.
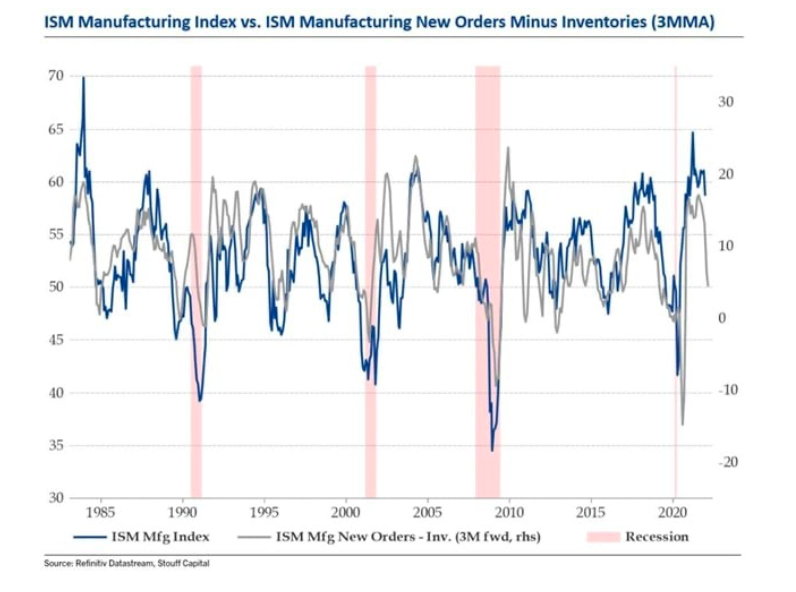
The first graph below, from Stouff Capital, shows the strong correlation between the difference of new orders and inventories compared to the ISM Index. The differential leads the ISM index by three months. If the correlation holds up, we should see a steep decline in ISM in the coming three months.
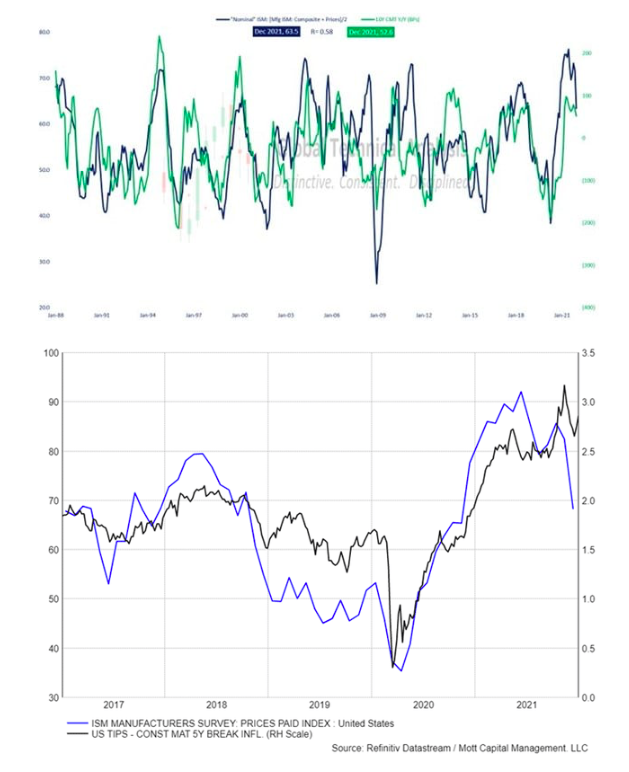
he following two graphs show how ISM’s decline may affect bond yields. The first graph below, courtesy of Brett Freeze, shows a statistically strong correlation between nominal ISM (inflation-adjusted) and ten-year UST yields. If the nominal ISM is reversing as it appears, we should expect lower yields. The second graph, courtesy of Mott Capital, charts the correlation of the ISM Prices paid index and inflation expectations. Assuming manufacturing inflation is finally cooling off, inflation expectations should follow. Lower inflation expectations will help reduce bond yields.
Rotations Matter
In 2021, the key to success was understanding when inflationary narratives would dictate market conditions and when deflation narratives drove investors. We do not think 2022 will be as simple.
It is quite possible that value versus growth and low beta versus high beta may be the rotations to key on. As we wrote in An Investment Playbook for Thriving During the Next Market Crash:
“We think it’s likely that value stocks will significantly outperform growth stocks in the event of a sizeable drawdown. Timing the transition from growth to value will be difficult, but such a rotation will likely prove invaluable. You may want to keep the 2000 investment playbook handy.”
Summary
If we learned anything from 2020, the future is far from certain. Not only should we expect the unexpected, but the market reactions to the unexpected may be vastly different than what many assume.
What we discuss above is our best guess as of today. We may be right in some areas and wrong in others. More importantly, we must adjust our expectations as political, economic, and monetary conditions and investor sentiment change.
Navigating 2021 in hindsight was easy. However, a year ago, the outlook was daunting. No doubt 2022 will offer us both risk and rewards. Limiting risks and reaping the rewards will help traverse what offers to be another tricky year.
Maybe, more importantly, relying on trusted economic and market models and not letting psychological biases hinder investment decisions may prove to be the best advice we can offer.
Twitter: @michaellebowitz
The author or his firm may have positions in mentioned securities at the time of publication. Any opinions expressed herein are solely those of the author, and do not in any way represent the views or opinions of any other person or entity.


")


