FOCUS TENDS TO BE SHORT-TERM
Investors and traders have a tendency to fall into the recency-bias trap over and over.
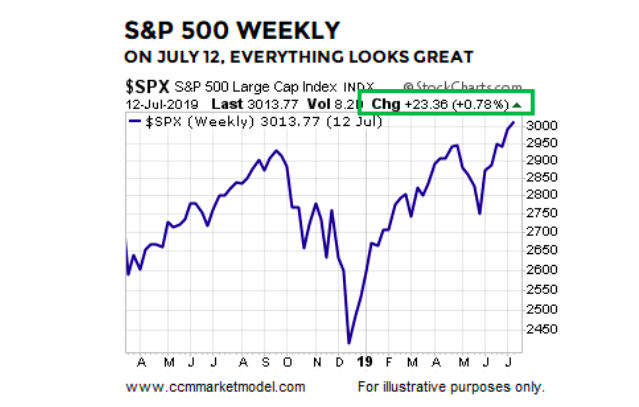
For example, after the S&P 500 Index (INDEXSP: .INX) closed at a new weekly high on Friday, July 12, it was easy to believe “the bulls are firmly in control”.
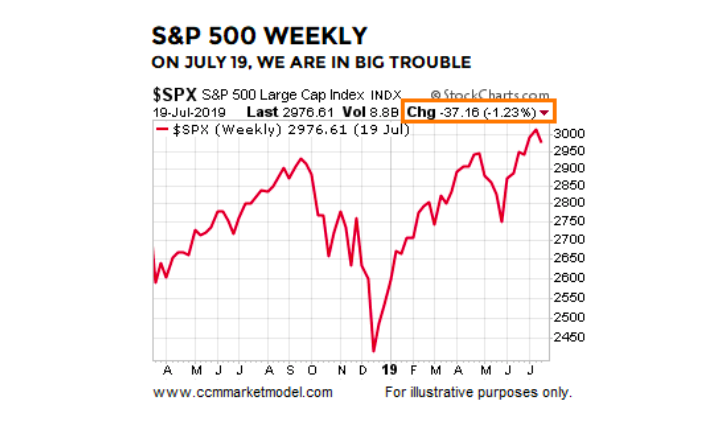
Fast forward to Friday, July 19, after the S&P 500 dropped 1.23% for the week, and it was easy to shift into “we are in big trouble” recency-bias mode.
RARE MARKET ACTION IN EARLY 2019 REMAINS RELEVANT
Dating back to 1950, the S&P 500 has only dropped over 40% three times: 1973-74, 2000-02, and 2007-09. In each case after the big drop, something caused investors to change their attitude and behavior related to the attractiveness of common stocks. Major lows are rare and the shifts that occur in the minds of human beings near major lows are rare. History tells us valuable information can be found in rare market events.
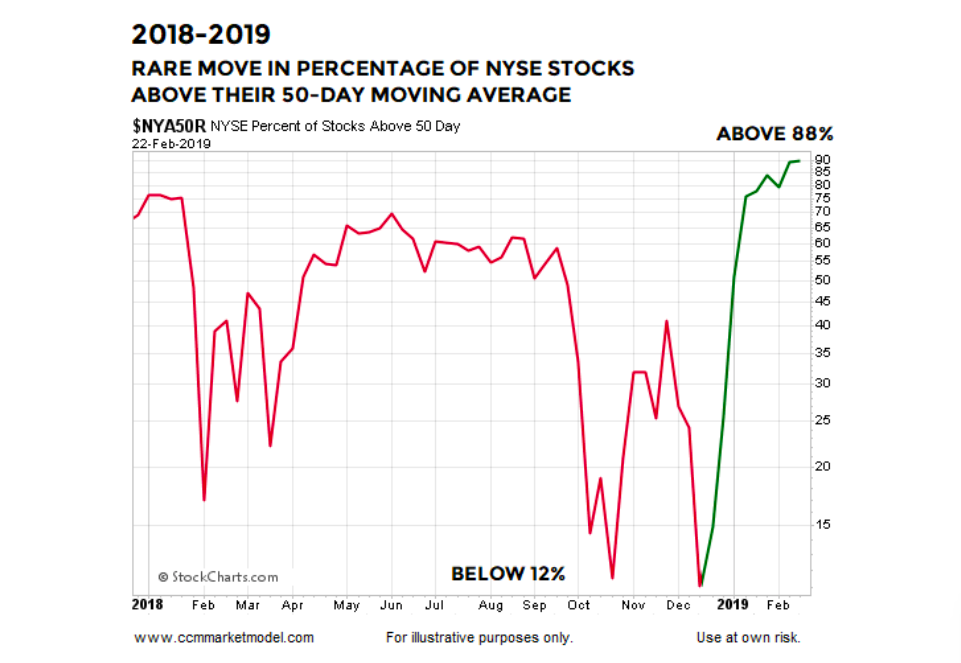
A rare event took place between the close on December 24, 2018 and the close on February 22, 2019. As shown in the $NYA50R chart below, the percentage of NYSE stocks above their 50-day moving average dropped below 12% and then rebounded to above 88%; a move that showed a significant shift in the perception of the stock market’s longer-term potential.
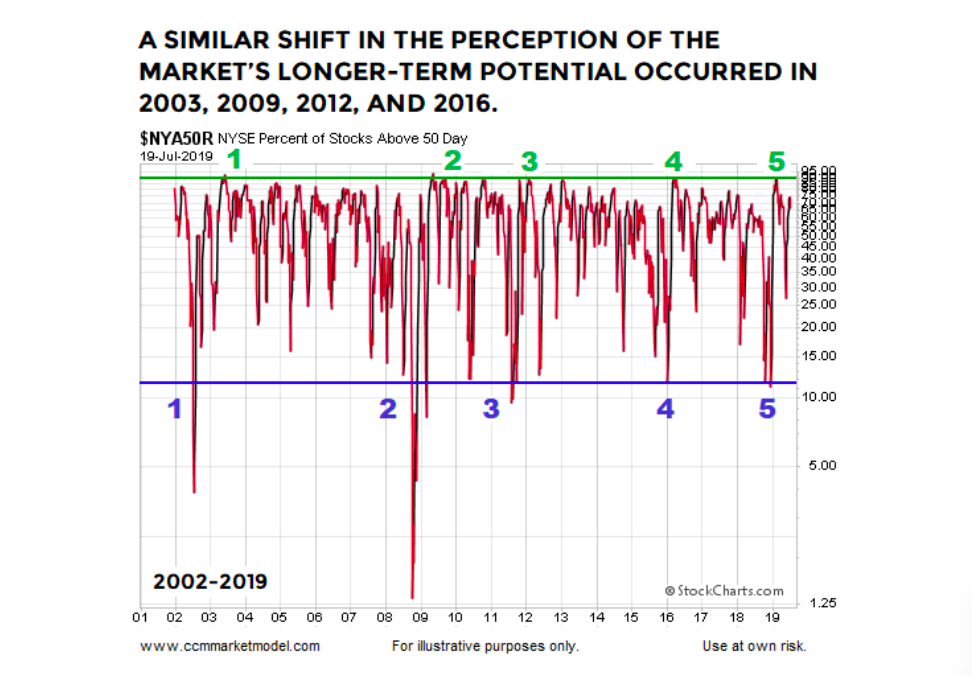
SIMILAR MOVES IN 2003, 2009, 2012, AND 2016
Going back to 2002, a similar shift in market participant perceptions occurred in 2003, 2009, 2012, and 2016. In each case, the percentage of NYSE stocks above their 50-day moving average dropped below 12% and then rallied back above 88%.
WHAT HAPPENED NEXT IN THE STOCK MARKET?
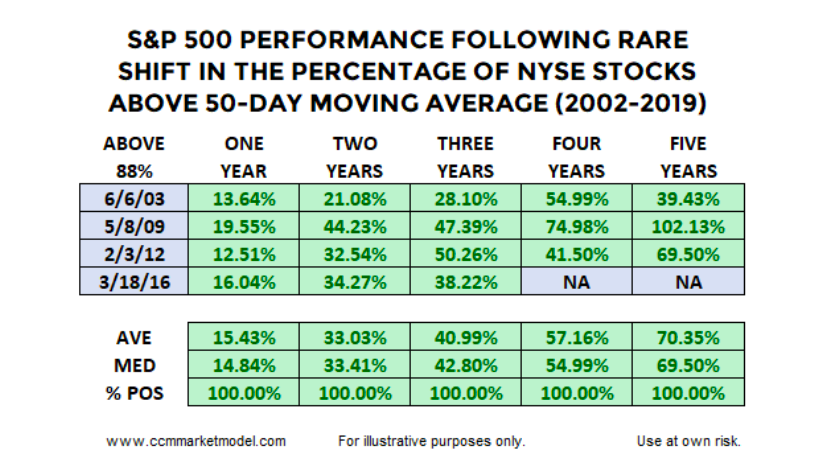
The table below shows S&P 500 performance in each of the four cases that featured the rare push from below 12% to above 88% in the percentage of NYSE stocks above their 50-day moving average.
DOES RECENT DATA ALIGN WITH FEBRUARY’S SIGNAL?
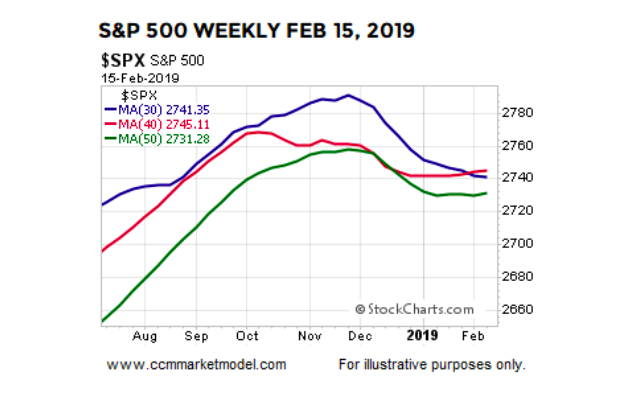
The push back above 88% in NYSE stocks above their 50-day moving average went into the history books on February 22, 2019. Therefore, if the 2019 market was following the historical script, we would expect to see additional improvement in the market’s technical profile over the past five months. For example, the chart below shows the S&P 500’s 30, 40, and 50-week moving averages on February 15, 2019. The chart shows a waning and indecisive look with the 30-week moving average (blue) having dropped below the 40-week (red).
To provide some historical context, the charts below show the S&P 500’s 30, 40, and 50-week moving averages during a bearish turn and a bullish turn.
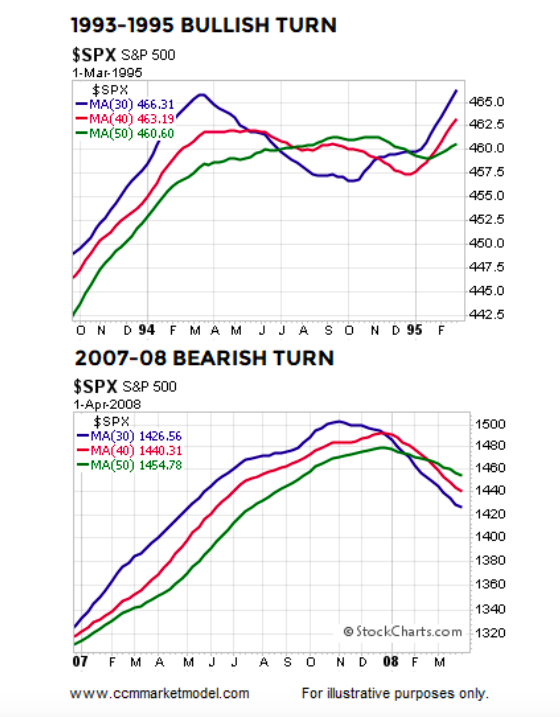
Therefore, if the bullish $NYA50R signal that appeared on February 22, 2019 was still relevant, we would expect the present day weekly S&P 500 chart to look more like the 1993-1995 case above relative to the more concerning rollover look on the 2007-08 chart.
HOW DOES THE SAME CHART LOOK TODAY?
The answer can be found in the opening segment of this week’s stock market video.
REALISTIC EXPECTATIONS ABOUT RED DAYS AND VOLATILITY
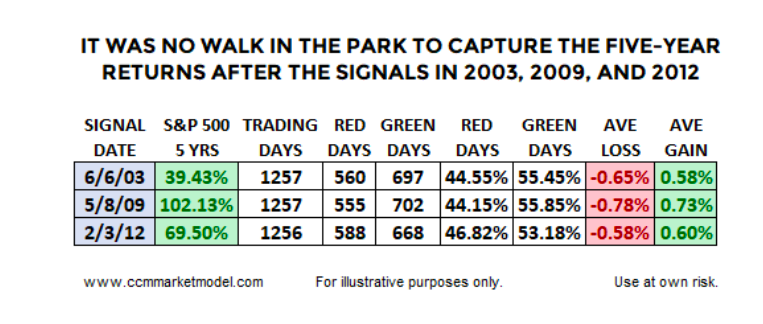
When we see a table like the one below, it may set unrealistic expectations about how the S&P 500 moved between point A and point B.
For example, to capture the five-year 102.13% S&P 500 return after the $NYA50R signal that occurred on May 8, 2009, an investor had to endure 555 red trading sessions that resulted in an average S&P 500 decline of 0.78%, which tells us falling prey to recency bias can lead to overtrading and disappointing returns.
MORAL OF THE STORY
Each year is unique and 2019-2024 will carve out a unique path. The historical cases simply provide some context for the 2019 data we have in hand; data that continues to tell us to keep on open mind about better than expected outcomes in the years ahead, while maintaining realistic expectations about day-to-day volatility. If the 2019 data shifts in a material manner, we will reassess the bull/bear probabilities.
Twitter: @CiovaccoCapital
The author or his clients may hold positions in mentioned securities at the time of publication. Any opinions expressed herein are solely those of the author, and do not in any way represent the views or opinions of any other person or entity.

: Cup (and Maybe Handle) Watch")
 Trading Near Top Of Price Range")

