If all goes well for nine more months, the post-financial crisis economic expansion will become the longest economic expansion in recent U.S. history.
The U.S. stock markets are also on a tear, having just become the longest bull market since World War II.
Regardless of your views about these trends continuing, the fact of the matter is that they are both much closer to ending than a beginning. Ray Dalio recently quantified this continuum, declaring that the economy is in the 7th inning, implying another one to three years of continuation.
While the S&P 500 (NYSEARCA:SPY) and broad stock market indexes can certainly keep motoring ahead, as Dalio and many others expect, there are some factors supporting the bullish case that investors should contemplate.
While this list is not by any means exhaustive, it does offer many of the most important assumptions supporting the market and some details to provide context and clarity.
15 Bullish Assumptions:
Corporate managers have become so adept at their jobs that profit margins and equity valuations will remain at, or rise from current nearly unprecedented levels.
- Market Cap : GDP – 99% historical percentile according to Goldman Sachs Investment Research (GS)
- Enterprise Value-to-Sales – 97% historical percentile (GS)
- Shiller’s CAPE 10 – 90% historical percentile (GS)
- Price-to-Book Value – 89% historical percentile (GS)
- John Hussman’s margin-adjusted CAPE – Record high including 1929 and 1999.
- Expected 10 year S&P 500 return as depicted in our article Allocating on Blind Faith is negative
- GMO 7-Year real return forecast -4.90% for U.S. large cap, -2.30% for U.S. small cap and -3.80% for U.S. high quality
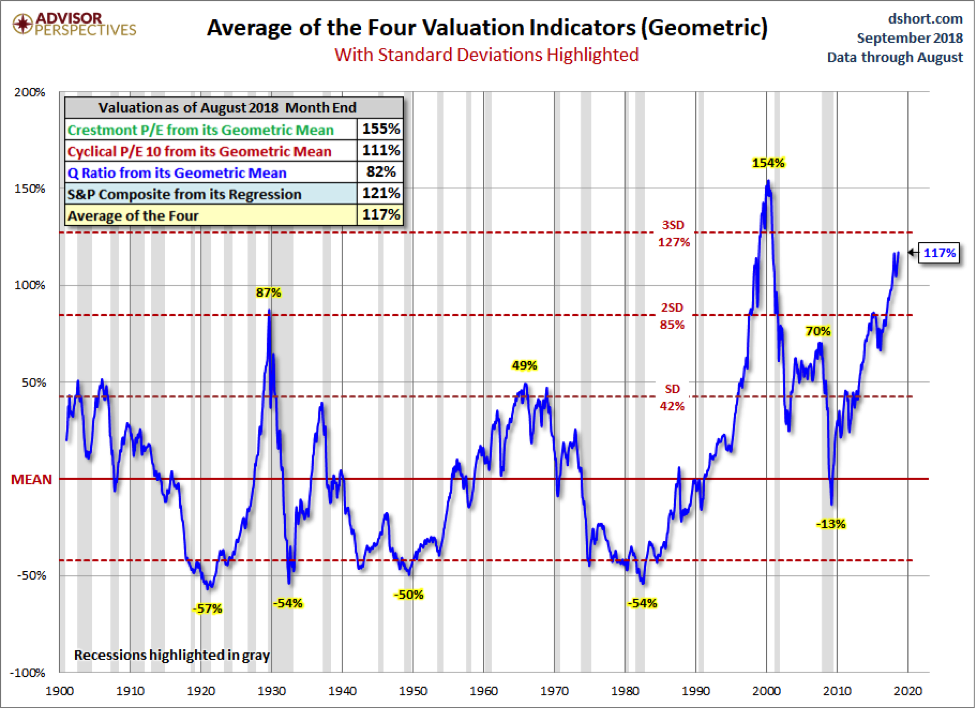
- Doug Short’s (Advisor Perspectives) Average of the Four Valuation Indicatorsis 117% overvalued as shown below and nearly 3 standard deviations from the mean
Bond yields will remain historically low and the 30-year downward trend will not reverse
- The 10-year U.S Treasury yield is slightly above a key 30-year resistance line at 3.11%
- The 30- and 10-year U.S. Treasury yields are testing multi-year highs of 3.23% and 3.12% respectively
- Since the lows of 0.70% in November 2016, the 2-year U.S. Treasury yield has risen 300% to 2.80%
- 3-month LIBOR, a key global interest rate for floating rate financing, has risen 282% from 0.62% in June 2016 to the current level of 2.37%
- Implied volatility on Treasury note futures is at historically low levels indicating extreme complacency
- GMO’s 7-Year real return forecast is -0.20% for US bonds
Future Fed rate hikes and possible yield curve inversion will not cause economic contraction
- The Federal Reserve (Fed) currently expects to hike rates an additional 1.50% bringing the Fed Funds rate to 3.50%, by the end of 2019
- The 2s/10s U.S. Treasury yield curve stands at 26 basis points and has flattened 110 bps since December 2016
- The Fed appears increasingly comfortable with inverting the yield curve “Over the next year or two, barring unexpected developments, continued gradual increases in the federal funds rate are likely to be appropriate to sustain full employment and inflation near its objective.” – Lael Brainard – Fed Governor
- The last five recessions going back to 1976 were all preceded by a 2s/10s yield curve inversion
- All six recessions going back to 1971 were preceded by Fed interest rate hikes. Two exceptions where rates hike did not lead to recession were in 1983-84 and 1994-95
Weakness in interest rate sensitive sectors will not have a dampening effect on the economy or markets
- Total automotive vehicle sales have declined 7.8% since the Fed started raising rates
- New and existing home sale have steadily declined since November 2017 as mortgage rates risen by over 0.50% over the this period
Wage growth will not accelerate further thus stoking inflationary pressures
- Employees gaining leverage over employers as jobless claims and the unemployment rate both stand near 50-year lows
- Wage growth is at a 9-year high
- Spike in the “quit rate” to 18-year high suggests more wage growth pressure coming
continue reading this article on the NEXT PAGE…


")


