It’s not uncommon for chart patterns to take some time to play out. And this requires patience and discipline from investors. On such example is Yahoo, Inc. (YHOO – Quote). I believe the stock has reached a critical juncture in time and price. And the current price level on YHOO have been on our radar since September 2014. Check out my post:
- Will Yahoo (YHOO) Top On Alibaba IPO Fervor?
- Is Yahoo Stock Nearing A Sell Pattern Top?
- Yahoo Topping Pattern Still In Play
The analysis has been updated and posted about once a month… and as we approach the Christmas break I thought it would be helpful to post another update. Here are some things to think about:
- Take note since the top on November 18, 2014 most every swing high or low has corresponded to a Fibonacci calendar day count. Yesterday’s high marks 34 calendar days since the high.
- 1, 1, 2, 3, 5, 8, 13, 21, 34
- The high yesterday finished another PATTERN that hit with very nice time and price symmetry. As you follow the blue shaded harmonic triangles you will see that today’s price PATTERN (sell) completed. We also have targets a little higher at $51.84.
- Again, this analysis will be wrong with a weekly close above $53 (where stops go).
- Yahoo’s stock is in either a distribution or accumulation stage. A case can be made for either. Watch the result of the PATTERN (sell) that occurred today for a heads up of the next move.
Yahoo Stock Chart – With Time & Price Analysis

Finally, I want to add another variable to our analysis of YHOO. It’s widely understood that Alibaba (BABA) received a substantial investment from Yahoo and, if you look at the charts they are pretty synchronized. Why is this important?
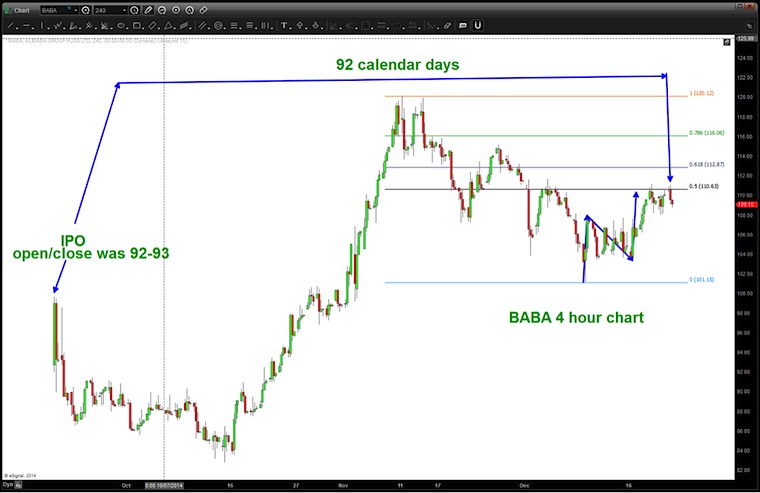
Well, if you go back to a blog I posted on the day of the Alibaba IPO you’ll find that we were going to work with the open/close prices to spin out time cycles. Guess what – the most recent high in Alibaba (BABA) was 92 calendar days ago and has finished a sell pattern as shown below:
Alibaba Stock Chart – With Time & Price Analysis
Summary: With the PATTERNS (sell) complete AND the basic time cycles shown hitting yesterday for BABA and YHOO, I believe a directional move is coming for YHOO that will resolve the high level of accumulation or distribution that has been happening over the past month. Thanks for reading.
Follow Bart on Twitter: @BartsCharts
No position in any of the mentioned securities at the time of publication. Any opinions expressed herein are solely those of the author, and do not in any way represent the views or opinions of any other person or entity.


 Rolling Over At Key Fibonacci Level?")