Back in September 2014, as the Alibaba show was lighting up the IPO world, I posted that this PATTERN was near completion for Yahoo (YHOO) stock.
In the world of pure play “advanced” pattern recognition, the fact that Yahoo made a bunch of money on the Alibaba (BABA) IPO has nothing to do with a PATTERN completing. So, the market took a little time to digest the IPO and YHOO is just now approaching its long standing PATTERN in/around the $48 to $50 per share price level. This PATTERN still stands.
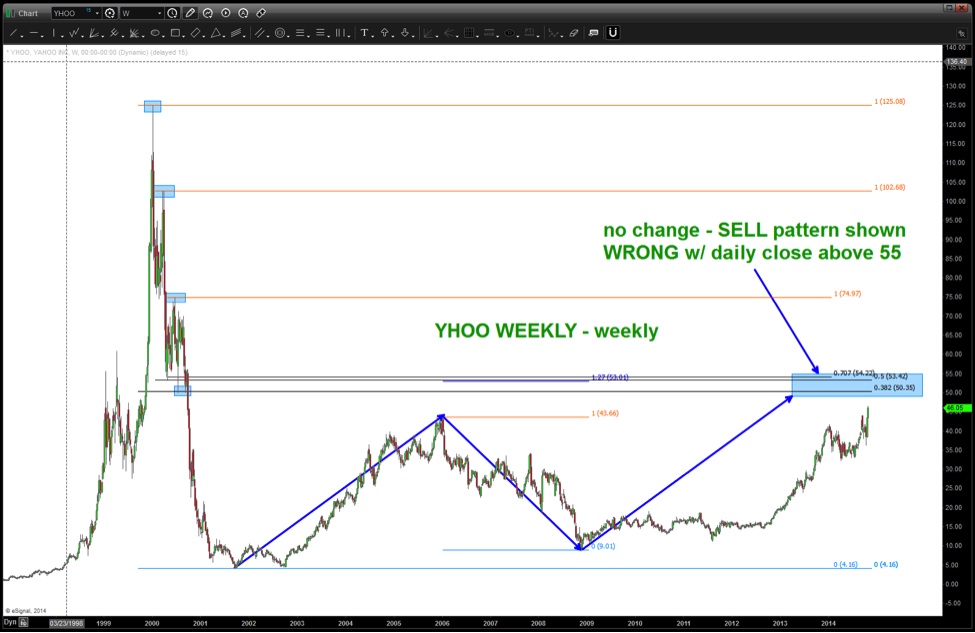
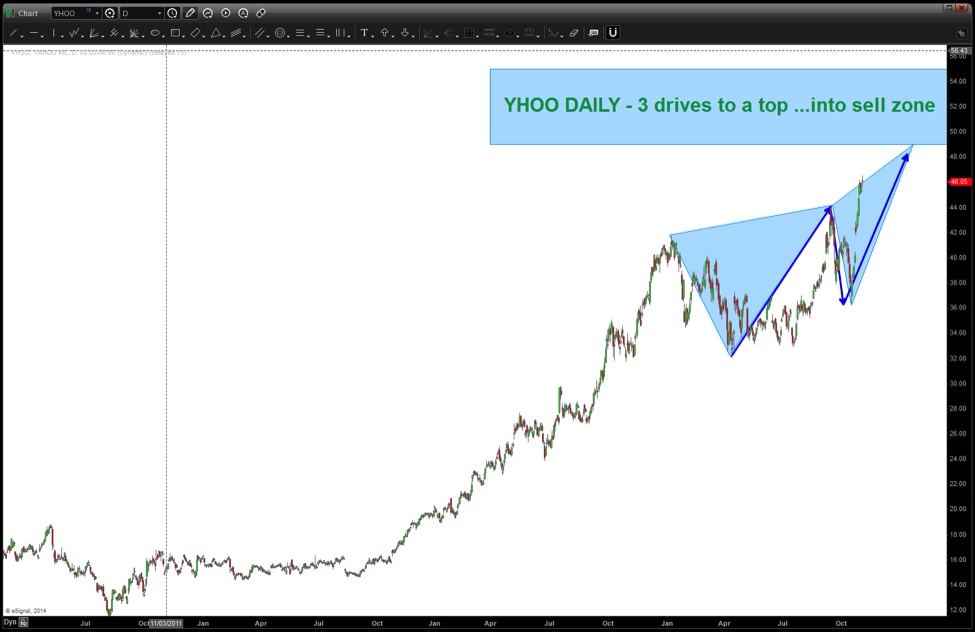
As with any pattern, I have no idea if this PATTERN will work or not. And really, I do not care on an emotional level (that’s why I like patterns). It’s simply a risk-defined SELL PATTERN on YHOO. This analysis will be proven WRONG with a daily close above 55.
After giving a seminar on the PATTERNs I was once asked “how often are you right?”
I paused and answered, “100% of the time.”
“100% of the time I know where I am WRONG….” Have a great week!
Here are the updated Yahoo stock sell pattern charts:
Follow Bart on Twitter: @BartsCharts
No position in any of the mentioned securities at the time of publication. Any opinions expressed herein are solely those of the author, and do not in any way represent the views or opinions of any other person or entity. Yahoo logo from Ingvar Bjork/123RF.COM.

: Worrisome to Broader Market?")

