This week all eyes were on the Pro Farmer Midwest Crop Tour, an annual pilgrimage through key corn (NYSEARCA:CORN) and soybean producing sections of South Dakota, Nebraska, Minnesota, Iowa, Illinois, Indiana, and Ohio. Could this help firm up the corn crop outlook for 2016?
Crop scouts were unleashed with the task of providing eye-witness observations and field samples in an attempt to establish corn and soybean yield estimates. These estimates are to be representative of what’s actually in the field versus what’s perceived to be in the field. More on the Pro Farmer’s report in a minute; first we’ll discuss one issue with USDA condition ratings.
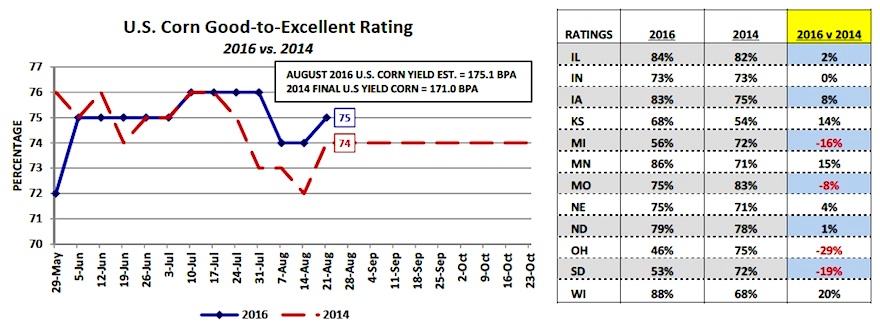
I’ve stated in the past that I believe subjectivity is the major weakness of the USDA’s Weekly Corn Condition Ratings system. And I think that was again on display this past Monday with the USDA making a counter-seasonal 1% increase in corn’s good-to-excellent rating (now rated 75% good-to-excellent versus 74% in 2014). The reality is whether this year’s final U.S. corn yield is 168-170 bpa or 173-175 bpa will depend on data that can only be fully quantified by this year’s corn harvest (plant populations, ear count, ear length, kernel rows per ear, etc.). The market is well aware the crop looks incredible… from the road.
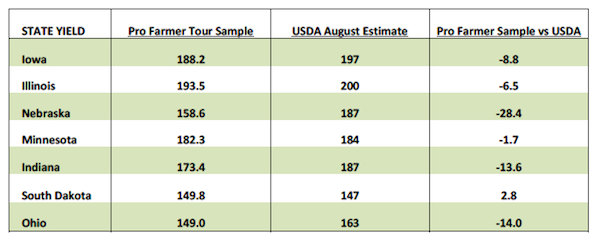
That said Pro Farmer’s state sample results essentially validated what I’ve believed all along. The 2016 U.S. corn crop is exceptional albeit not record-breaking. Crop scout field sampling showed corn yields averaging 193.5 bpa in Illinois and 188.2 bpa in Iowa versus the USDA’s August yield estimates of 200 bpa in Illinois (equal to its record from 2014) and 197 bpa in Iowa (record by 5 bpa versus 2015). However it appears the two states that are currently aggressively over-estimated by the USDA are Ohio and Nebraska. The tour found yields averaging 149.0 bpa in Ohio versus the USDA’s August forecast of 163 bpa. In Nebraska the tour came back with a yield estimate of 158.6 bpa versus the USDA’s August yield of 187 bpa. Nebraska is the 3rd largest state corn producer in the country. This definitely weighs in on (and agrees with) my corn crop outlook for 2016.
Do I believe Pro Farmer’s state yield estimates at face value? No. However I do think they are indicative of a trend, which again supports the notion that this year’s U.S. corn crop is great. But, it’s likely not on par with 2014 regardless of what the USDA’s current crop condition rating suggests.
Weekly U.S. Corn Export Sales Summary:
U.S. corn exports for the week ending August 18th, 2016 totaled 44.5 million bushels for both old and new-crop sales combined. 41.7 million bushels of that total represented 2016/17 export sales (new-crop) versus 41.0 million a week ago. In general U.S. corn exports continue to perform consistently well week-to-week, which I expect to be a common theme for the next several months. Furthermore, this week the Institute of Agricultural Economics issued a revised safrinha corn production forecast for Mato Grosso of 19.3 MMT, down 26% from last year. Mato Grosso plays a vital role in Brazil’s available export market share. This once again underscores the reality that the recent surge in U.S. corn export sales likely isn’t an anomaly. I also believe it helps to validate what some considered an optimistic 2016/17 U.S corn export forecast of 2,175 million bushels in the August 2016 WASDE report versus the prior 3-year average of 1,904 million bushels.
Weekly U.S. Ethanol Production & Stocks Summary:
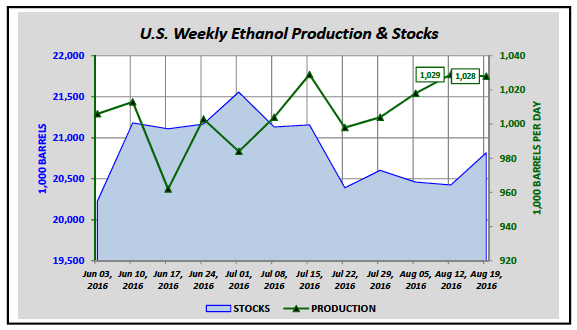
The EIA reported U.S. ethanol production for the week ending August 19th, 2016 of 1.028 million barrels per day versus 1.029 MMbpd last week and the 4-week average of 1.020 MMbpd (record high 4-week average, up 6.1% versus 2015). For several weeks U.S. ethanol production has been running at an unprecedented rate; however somewhat surprisingly over that same period of time, U.S. ethanol stocks have essentially trended lower. In fact since June 10th U.S. ethanol stocks moved from a June high of 21.182 million barrels down to 20.425 million barrels on August 12th, 2016. That said this week the industry saw its first material sign that an upward momentum shift in U.S. ethanol stocks could be in the offing with stocks reported at 20.817 million barrels, up 329,000 barrels week-on-week. Why do I believe this week’s stocks increase could represent a looming upward trend change? U.S. gasoline demand starts to turn seasonally lower in September. In 2015 gasoline demand fell 4.7% from August to September versus a nearly identical 4.8% decrease in 2014. Therefore if a similar pattern ensues in 2016, the amount of ethanol blended into gasoline should fall considerably during the month of September. If the industry continues to produce ethanol in excess 1.0 MMbpd future stocks increases appear unavoidable (even with strong exports). I would expect this to provide additional pressure to current CME ethanol prices.
December Corn Futures Price Forecast
December 2016 corn futures closed down 7-cents per bushel on Friday at $3.25. For the week CZ6 closed down 18 ¾-cents per bushel. Clearly it was not a good week for Corn Bulls with the corn market getting absolutely no help (residual support) from the soy complex, which also experienced considerable price pressure. November 2016 soybean futures closed down 37 ¼-cents per bushel week-on-week.
continue reading on the next page…


")


 Rolling Over At Key Fibonacci Level?")