The presence of flat 200 day moving averages throughout many of the US Stock Market Indices and sectors, combined with a few other factors, is causing me to maintain a neutral stance toward equities for the time being. Luckily, as a technician I can take advantage of opportunities in other non-correlated liquid asset classes when I don’t have much conviction long or short the equity markets.
A Closer Look At Soybeans…
That being said, Soybeans look interesting on the long side for a number of reasons.
1. Soybeans has no correlation to the S&P 500, which is great given my view on equities at the moment.
2. Commercial hedgers are net long and getting longer, with their position slowly creeping its way back toward multi-year highs.
3. In terms of public sentiment, pessimism may not be at the extreme levels it reached earlier this year, but is still at levels not seen since late 2006.
4. Seasonality is pretty neutral into year end. While not a major tailwind, it’s good to be aware that history would suggest it shouldn’t be a headwind for higher prices going forward.
5. Soybeans are oversold and reached downside targets, whereby the price action may be calling for Soybeans mean reversion.
Overall, this backdrop for prices looks like it has the potential to support a short squeeze, but let’s take a look at what prices are indicating.
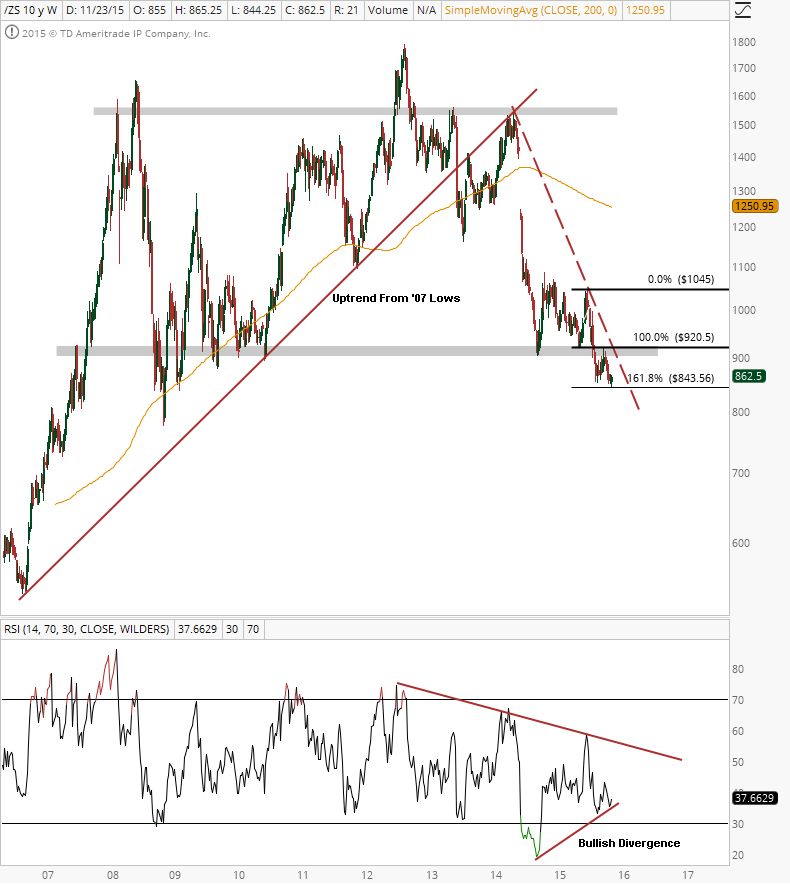
From a structural perspective, Soybeans prices have been in a downtrend since breaking the uptrend support line from the 2007 lows, reaching multiple downside targets around $900. Unfortunately, prices failed to gain much traction and broke below that long-term support level in August of this year.
In terms of positives, prices have recently reached the 161.8% extension of the May-July rally as momentum put in a bullish divergence. If the other timeframes agree, we could see a bit of a mean reversion start from current levels. A break above $900 would be extremely constructive from a structural perspective, but it’s important to set the tone for this setup as nothing more than a counter-trend trade with Soybeans mean reversion taking place. Until (and unless) we get back above that broken support & downtrend line, it’s nothing more, nothing less.
Soybeans Weekly Chart
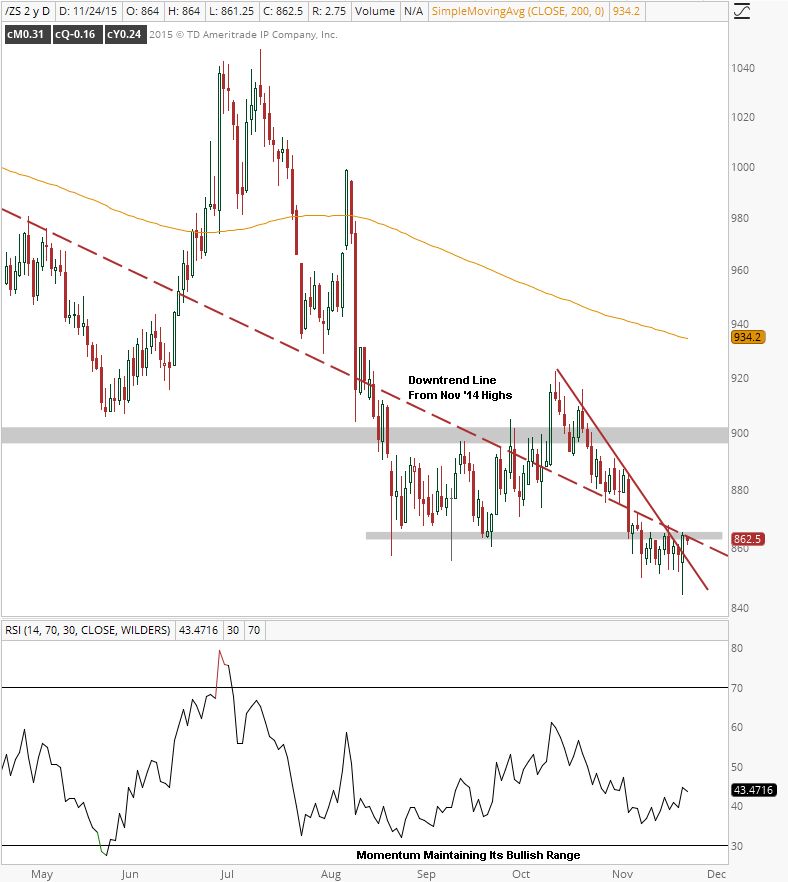
On the daily chart we can see that soybeans prices have been stair stepping their way lower over the past few weeks after failing to retake prior support at $900. Prices have since consolidated below the prior lows for a number of days and put in a sharp red to green reversal after hitting the Fibonacci extension discussed on the weekly chart. If soybeans prices can get back above this $868 area which represents prior support and the downtrend from the November highs, we can see a quick move toward 900 and possibly a test of the 200 day. Another positive for this market is that momentum never hit oversold conditions on any of the recent selloffs, indicating that its bullish range remains intact on the daily timeframe.
Soybeans Daily Chart
On the hourly chart we can see the sharp reversal off the intraday lows as soybeans prices reached the 161.8% extension of the 10/9-10/14 rally, while momentum diverged positively.
continue reading on the next page…


 Ready To Break Out?")
 Rolling Over At Key Fibonacci Level?")
