Here we present updates to our March 2016 forecast for the iShares Barclays 20+ Year Treasury Bonds ETF (symbol TLT) and our September 2015 forecast for 30-year treasury bond futures. Our outlook is bearish treasury bonds (both issues), consistent with the idea that the Fed will raise interest rates one or more times in 2016. However, it is too early to calculate downward targets for either treasury bonds issue until there is some confirmation of a turn.
In September, we projected an upward path for treasuries to trace a three-wave move from their 2013 low. Soon after that post, price found support slightly beneath our target area. Subsequent rallies took treasury bonds and treasury bond futures prices to new highs while also fulfilling Elliott wave requirements for a completed ending diagonal pattern on a larger scale, up from 2007.
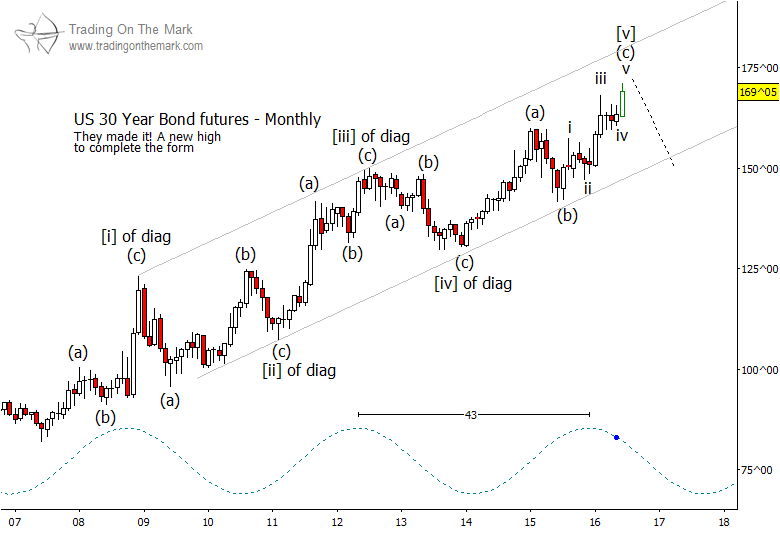
The monthly chart below shows how the price of 30-year treasury bond futures has formed a series of five waves, [i]-[ii]-[iii]-[iv]-[v], with each wave consisting of three sub-waves labeled as (a)-(b)-(c). With this month’s new high, the final leg of (c) of [v] might be counted as complete. If/when wave v completes, it will mark a time for traders to be bearish treasury bonds.
Our target area for wave v also coincides approximately with the peak of the dominant 43-month price cycle. In addition, the unusual divergence between treasury bond prices and yields, which we highlighted in our March post, remains in effect. We interpret that as a bearish sign for treasury bonds.
This sets up a situation where any rise in interest rates or other shock to bondholder confidence could cause the expected downward move to begin. While we do not believe bond prices will crash, a decline from their current area should persist over several years.
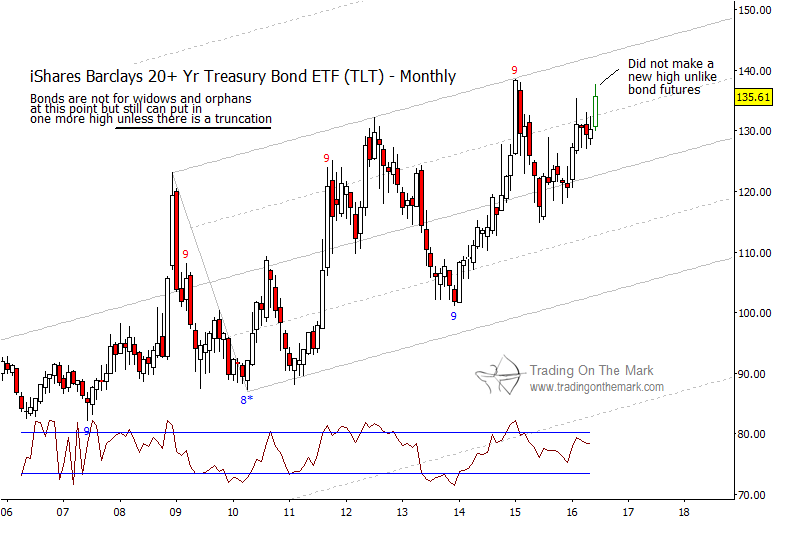
The picture for the 20+ year treasury bonds ETF (ticker symbol TLT) remains similar to what we described in March, although the pattern has deviated somewhat from our forecast. In contrast to new highs in bond futures, TLT continues to present a lower high versus that of early 2015. Normally we would expect the Elliott wave pattern in TLT to match the pattern in bond futures. However, with the current divergence between the two, and with the count possibly being complete for treasury bond futures, we are alert to the possibility of failure (pattern truncation) prior to a new high in TLT.
For traders and investors, the take-home message should be that long positions in treasuries and related products is very risky at this point. There are plenty of bearish signals. It may even be time to start shopping for short positions.
Note that you can keep up with posts and articles from Trading On The Mark by following us on Twitter (link below) and facebook!
Thanks for reading.
Twitter: @TradingOnMark
No position in any of the mentioned securities at the time of publication. Any opinions expressed herein are solely those of the author, and do not in any way represent the views or opinions of any other person or entity.


")


