Following our recent post about divergence between the German DAX and the S&P 500 Index, here we will examine another case of intermarket divergence that may have predictive value. In recent weeks, the Russell 2000 Index has been making lower highs while the NASDAQ 100 Index has been making higher highs. That development along with pattern analysis suggests that the broader market may be approaching another correction or even a reversal.
Despite their different constituent stocks, the NASDAQ 100 (NDX) and the Russell 2000 (charted here via the exchange-traded fund with symbol IWM) typically move in a fairly synchronized way. They usually reach higher highs or lower highs on approximately the same dates. Notable periods when the two stock market indices have moved out of sync during a bull market run have included summer and autumn 2007, spring 2011 and autumn 2014 – periods that preceded substantial stock market corrections. In each of those cases, the NASDAQ 100 achieved higher highs on daily and weekly charts while the Russell 2000 was printing lower highs.
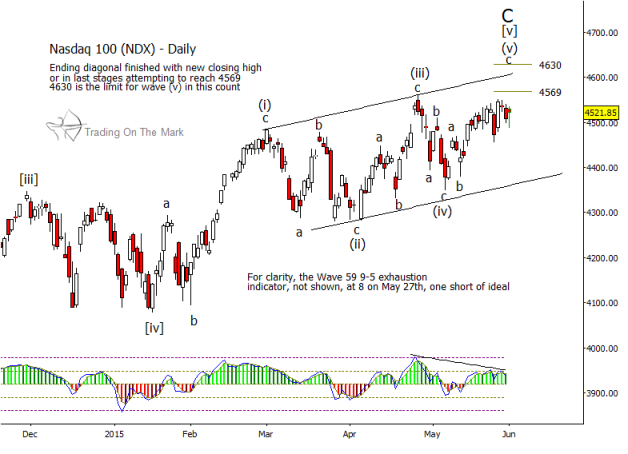
We may be seeing a similar development now. When NDX reached a new high in April, IWM printed only a lower high. Now in early June, NDX has again rallied to test near its record high, and it may be poised to rally even higher into one of the target areas shown on the weekly chart below. However, The Russell 2000 ETF (IWM) has lagged severely during the same period.
Equally important are the relative states of completion of the patterns in NDX and IWM. In each index, we see a pattern that we believe is nearly complete, and that has implications for where the broader market may go next. We believe NDX has traced nearly all of an ending-diagonal pattern – a terminal pattern which should be followed by a sizable decline.
NASDAQ 100 (NDX) Chart
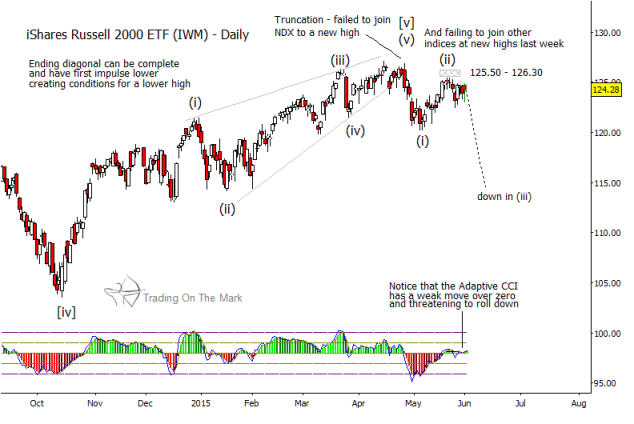
At the same time, IWM appears to have completed a terminal diagonal pattern in April. It’s subsequent decline and weaker rally have the characteristics of a motive wave downward followed by an upward retracement. This too should be followed by a sizable decline.
The fact that both indices appear poised for a decisive downward move at the same time suggests that the next few weeks may be especially risky for bullish equity traders more generally. Each index is presenting its own version of a reversal pattern, and the sequence in which they are doing so matches what has happened before prior corrections.
RUSSELL 2000 ETF (IWM) Chart
If you plan on trading this year, let us help you catch the next big moves in the markets. You can request a selection of timely posts that are normally available only to our subscribers by clicking here.
We make it our mission to help traders navigate market swings and position themselves to catch the trends. Thanks for reading, and happy trading!
Twitter: @TradingOnMark
No position in any of the mentioned securities at the time of publication. Any opinions expressed herein are solely those of the author, and do not in any way represent the views or opinions of any other person or entity.


