When major stock market indices begin following different paths, they can sometimes warn of turbulence ahead. This month, two high-profile U.S. stock indices rallied to new highs while other indices in the U.S. and Europe formed strikingly lower highs – we wrote about the Russell 2000 non-confirmation earlier this month. In this post, we will present a quick survey of a few other intermarket divergences we have observed.
If recent history is a guide, disagreement between the major european stock market index, the German DAX, and similar U.S. indices often precedes a correction. In the charts below, note how the DAX has lagged severely behind the S&P 500 (SPX) during April and May. Provisionally, the action in the German DAX has the look of an upward retracement, whereas SPX appears to be in the process of completing an advancing diagonal pattern (probably a terminal pattern).
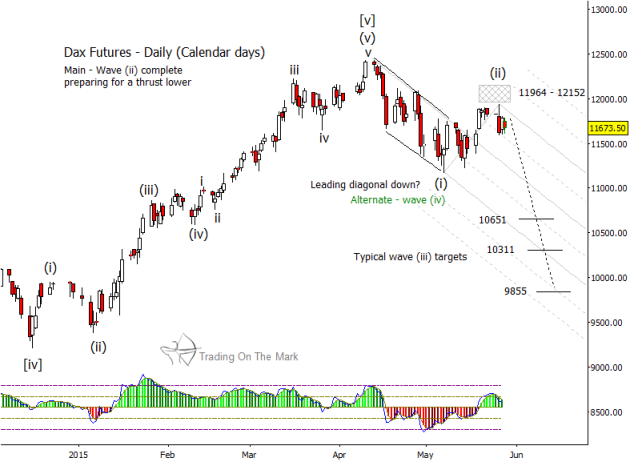
If the DAX is in fact retracing, as envisioned in our primary scenario, then price should fall away from the target box shown around 11,964 to 12,152, and the first significant lower target should be near 10,651 based on Fibonacci relationships. And this would confirm the intermarket divergence.
German DAX Index Daily Chart
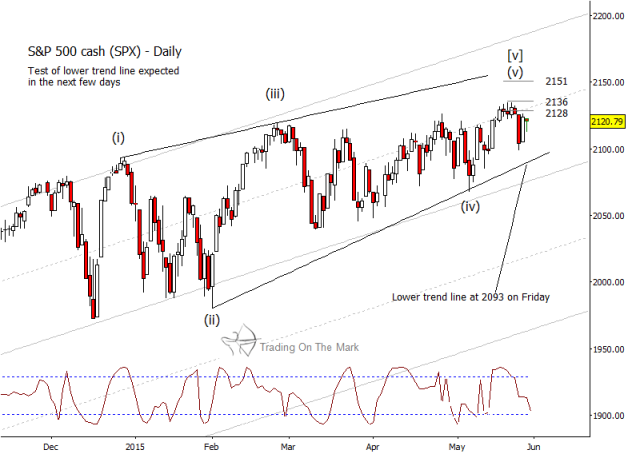
If the S&P 500 (SPX) declines from near its present area, then the first important test of support will arrive at the trend line that has defined the lower edge of the diagonal structure. Unlike the German DAX, there are not yet enough waves to project Fibonacci targets below that with confidence. However, keep in mind that structure could allow SPX to reach the higher resistance targets shown on the chart and still be consistent with an ending diagonal pattern.
S&P 500 Index Daily Chart
In coming days, we will post additional charts here that show more intermarket divergences and near-term targets for other U.S. indices.
We make it our mission to help traders navigate market swings and position themselves to catch the trends. If you plan on trading this year, you can check out a series of our posts that are normally available only to our subscribers. We cover equity indices, currencies, treasuries, metals, and commodities for our subscribers, and we will deliver our premium analysis to you over a period of about two weeks.
Thanks for reading, and happy trading!
Twitter: @TradingOnMark
No position in any of the mentioned securities at the time of publication. Any opinions expressed herein are solely those of the author, and do not in any way represent the views or opinions of any other person or entity.


