A little history can help investors with flexibility.
Since the S&P 500 recently completed a very rare period of “V” stock market bottoms, it is easy to visualize and understand the “rapid bottom and push to new highs” case for stocks. But recency bias tells us we may have pushed other historical examples to the side.
Since it is important that investors remain flexible and open to all outcomes, the charts below can help us with the “what if stocks do not bottom for weeks or months” scenarios. The charts below can also help us better identify patterns and candlesticks (the “process”) that may appear during market corrections or subsequent stock market bottoms.
And what better way to remember each market of these stock market bottoms than with a memorable song title.
1990 – “U Can’t Touch This”
In 1990, MC Hammer was near the top of the charts. Stocks were on the lower end of the charts, peaking in July and then making a series of lower lows before finding a bottom.

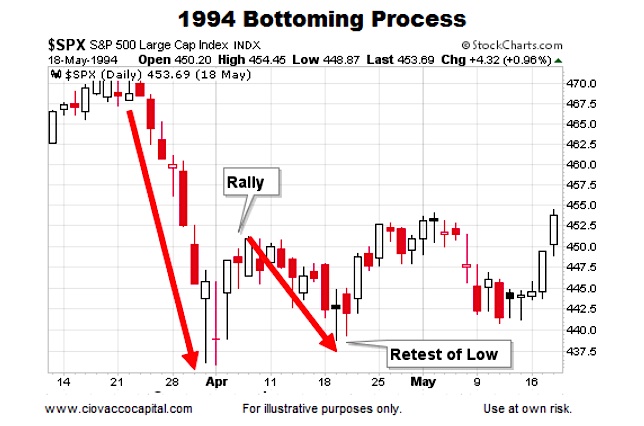
1994 – “All I Wanna Do”
Sheryl Crow reminded us to stop and smell the roses. The stock market smelled nothing like roses, making a low in early April. Equities did not turn up convincingly until mid-May.
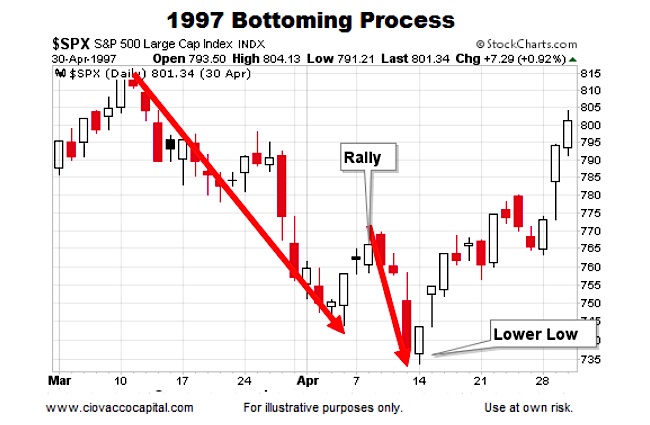
1997 – “Staring At The Sun”
U2’s big 1997 hit required respect for your corneas. Stocks also required a “look away” period, dropping significantly between mid-March and mid-April. Several “green days” were mixed in for confusion purposes.
1998 – “Time Of Your Life”
Green Day’s 1998 hit would later be used in the final episode of Seinfeld. Stocks told a story about nothing, correcting in an up and down manner for almost three months.


