One of my favorite analytical techniques for generating insights on global markets is studying stock market breadth.
And those who know me know I like to take a bit of an alternative angle, and today’s chart is no exception.
What makes today’s chart so interesting is that (in contrast to most of the stuff out there right now) it presents a bullish take on global equities.
With investor sentiment still mostly on the bearish side, particularly on the fundamentals outlook, anything with a bullish slant should be greeted with particular interest.
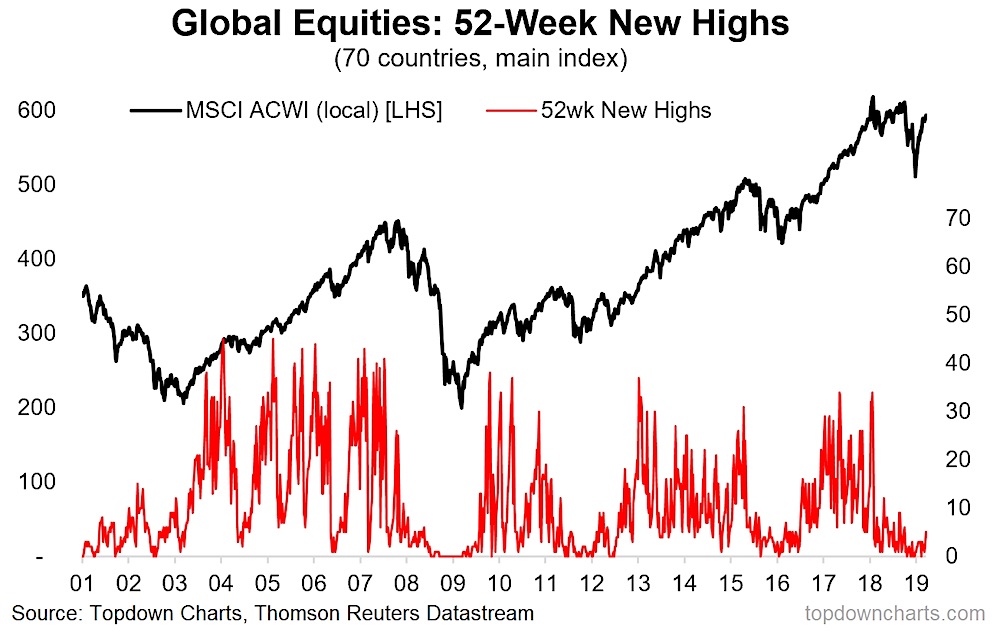
The chart shows the count of 52-week new highs for the main equity benchmark across the 70 countries we monitor (NASDAQ: ACWI). If you look closely you can see a slight tick up.

The chart comes from a recent report I wrote on the outlook for global equities. As you might imagine I’m in the optimist’s camp.
Focusing in on the chart, it’s a very familiar pattern we’re seeing here in this market breadth indicator. I’ll give you a hint, the last few times we saw something like what we’re seeing now was in 2009, 2011, and 2016.
The complete disappearance and gradual reappearance of 52-week new highs has served as a reasonably reliable signal of a major market bottom. So the punchline is this tick-up in the indicator may very well amount to “green shoots” for the outlook here as global equities teeter between bear market and bull market.
Though it’s early days in what is a relatively choppy indicator, it is certainly something to keep front of mind as we progress through this complex stage of the market cycle.
Twitter: @Callum_Thomas
Any opinions expressed herein are solely those of the author, and do not in any way represent the views or opinions of any other person or entity.


