Ahead of today’s Employment Report (NFP), we took a look yesterday at the S&P 500’s (SPX) performance on Fridays over the last year in general, and NFP Days in particular. With the S&P off 0.75% at mid-day, it looks as though stocks may buck the prevailing trends of the last 12 months – 28/52 Fridays up, including the last 10/11; and 10 of 12 NFPs up – to start August off in the red.
Today’s NFP – 209k jobs v. 298k in June, and a U-3 headline unemployment rate ticked up to 6.2% v. 6.1% lat – was variously represented in financial news media as “dovish”, “goldilocks” and “good enough” to pull forward the inception of the Fed’s next tightening cycle.
Whatever the most well-reasoned perspective is on the policy and broader macroeconomic implications of this report, one thing is certain: NFP is trending positively in a rare and sustained fashion. As the BLS points out in their report, “Total nonfarm payroll employment increased by 209,000 in July, the same as its average monthly gain over the prior 12 months”, largely driven by a today’s sixth consecutive print over 200k.
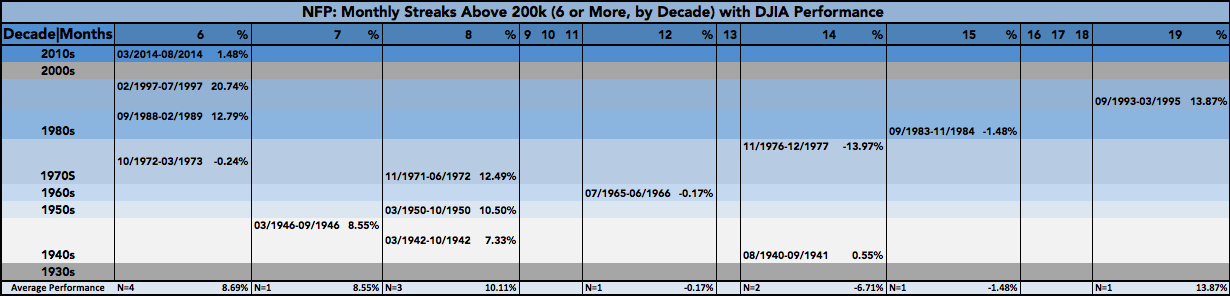
So just how rare is the current streak? Since the BLS began tracking data in 1939, Nonfarm Payrolls net change (M/M) has been above 200k for 6 months or more on 12 historic occasions. Here they are along with the current one and the Dow Jones Industrial Average‘s (DJIA) net performance during each period (click image to zoom):
A few key statistics:
- Of the 906 months reported, 129 have been part of one of these streaks, or 14.2% of the time.
- Of the 906 months reported, only 105 (11.5%) are spent in a streak of more than 6 months.
- The average general performance of these periods is 5.57%. Median: 6.45%
- Of those streaks lasting only 6 months (excluding the present), the average performance is 11.09%. Median: 12.79%
- In contrast, the current 6-month streak (which completes at the end of August) is up only 1.48% (through 07/31/14).
- 9 of 12 (75%) NFP streaks that make it to 6-months continue at least 1 additional month.
- 8 of 12 (67%) streaks have positive performance, averaging 9.81%.
- The other 4 of 12 (33%) streaks with negative performance average out to -3.97%.
- The current streak (still in progress) ranks 7th of 13 in performance, and 7th of 8 among positive streaks.
From this data, we learn that despite the rarity of the current streak of months with a >200k NFP, 1) it is likely (75%) the streak will extend at least one more month, 2) these streaks usually (67%) complete in positive territory, and that 3) the current streak (still in progress) underperforms both the mean and median of 6 month streaks in particular, and all streaks of 6 months or more in general.
The data overall is positive for employment and constructive for stocks; but the current streak’s laggard performance is disappointing by historical standards, in part reflecting the atypical labor and macro environment we yet find ourselves in some 5 years after the 2008-2009 recession ended.
Twitter: @andrewunknown and @seeitmarket
Author holds no exposure to securities mentioned at the time of publication. Commentary provided is for educational purposes only and in no way constitutes trading or investment advice.


")


")
 Rolling Over At Key Fibonacci Level?")