Despite (or because of) the punishment stocks sustained Thursday, many traders, active investors and market observers seem relatively well-assured equity markets won’t sustain anything more than a mild pullback.
Bolstering this view is the near-universal recognition that Friday has (once again this year) assumed the mantle from Tuesday for the latter half of the year as the session for equity outperformance.
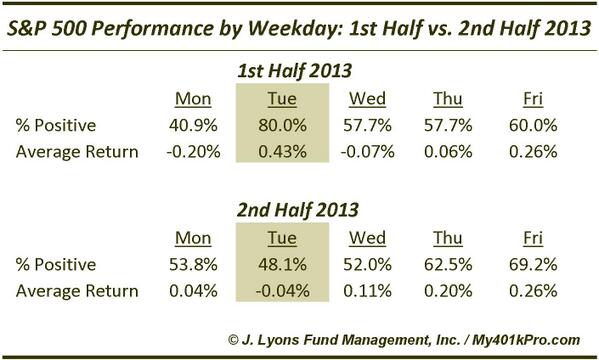
Courtesy of our friends at J. Lyons Fund Management, notice how the concentration of daily positive returns in Tuesday in the first half of last year diffuses across the week in the latter half, with Fridays most consistently positive and featuring the best average return:
Let’s compare 2013’s complete data above with the cycle unfolding in 2014. To do this, have a look at fellow SeeItMarket Contributor Ryan Detrick’s July 18th table breaking down 2014’s year-to-date performance by day of the week:
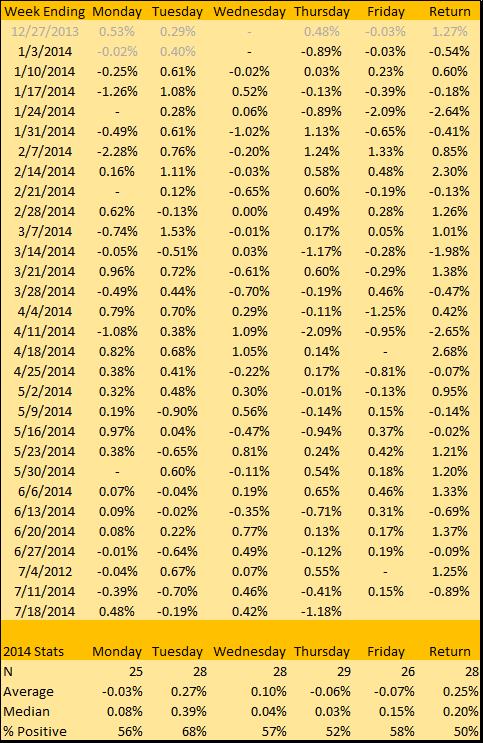
As Ryan pointed out 2 weeks ago, Tuesday began 2014 up 15/17; but has since finished down 8/12. Looking at the year-to-date Tuesday and Friday returns above, it certainly looks like this year is setting up to repeat 2013’s mid-year handoff to the last trading day of the week.
With this context in mind, let’s check out how Friday has performed in more detail by reviewing the latest rolling 12 month period of Fridays (August 2013-July 2014).
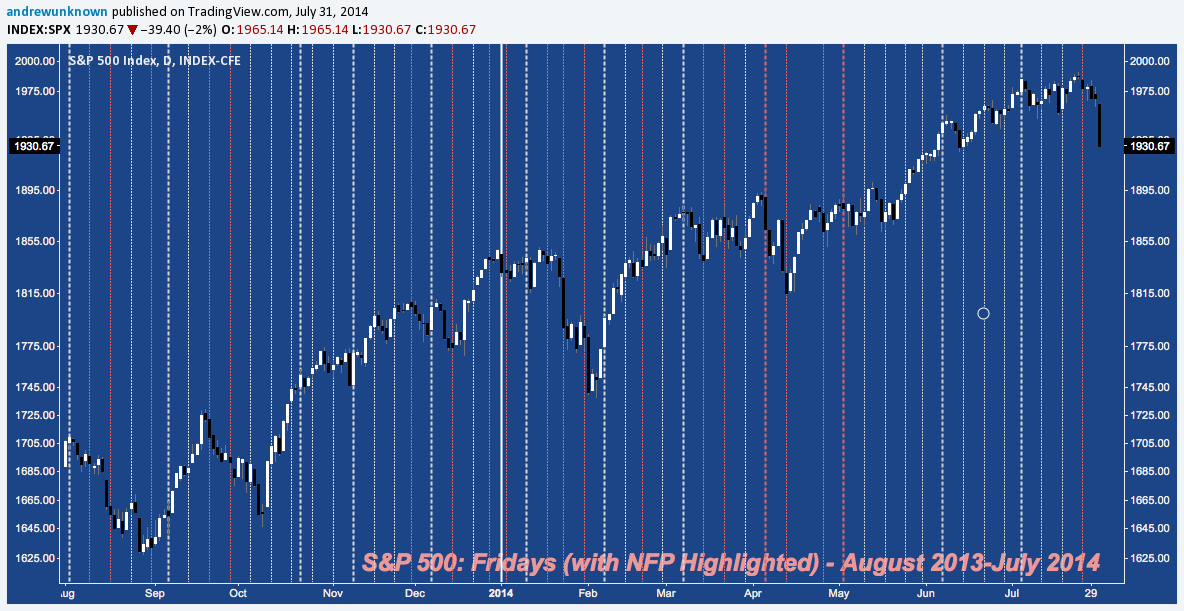
Here’s a chart highlighting each Friday over the last year. White dashed lines are positive, red dashed lines are negative, while bold dashed lines denote NFP/ Unemployment Fridays:
Below, you’ll find a comprehensive breakdown of the chart above. There’s a lot of data so the chart is small, but you can click to zoom in further:
S&P 500 (SPX) — August 2013-July 2014: Friday (and NFP Friday) Performance (click chart to zoom)
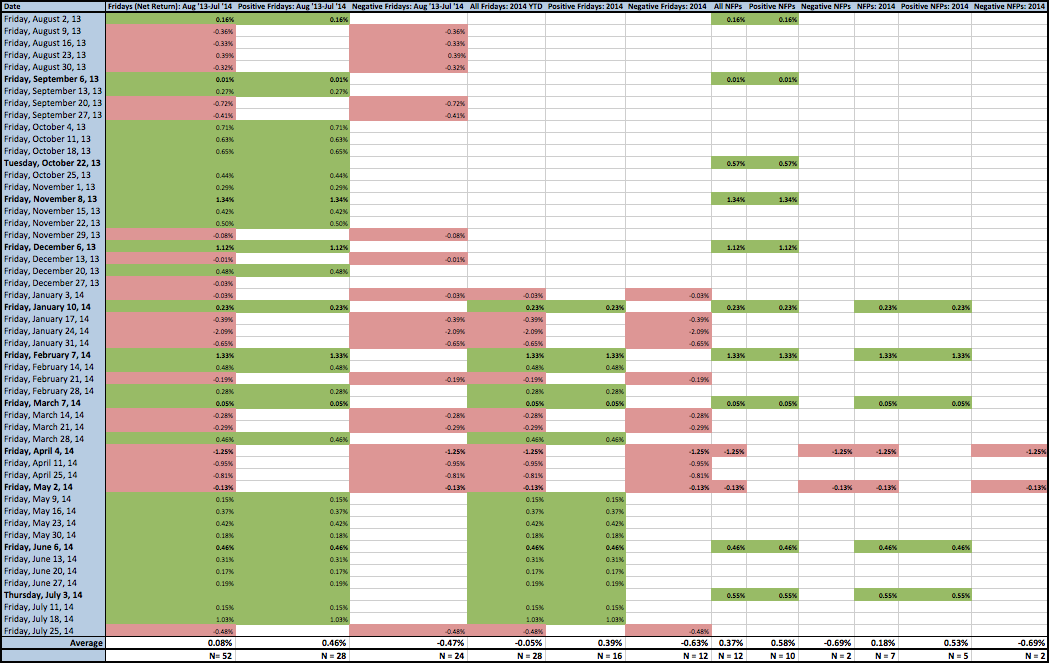
There’s a lot to pull out of the chart above. Here are the highlights to take with you into Fridays throughout the rest of 2014, and NFP Fridays specifically.
Fridays in general over the last 12 months:
- Fridays are subject to seasonality as discussed; but their performance nets out to flat over time.
- Average net Friday performance over the last year: 0.08%
- Positive Fridays average +0.46% over the last year.
- Negative Fridays average -0.47% over the last year.
- The reason the last year is positive: more up Fridays (28, or 53.9%) than down (24, or 46.1%).
- The last 10 of 11 (91%) Fridays have been positive with an average net performance of 0.27%.
Fridays in 2014:
- Fridays (through July): 28
- Positive Fridays: 16 (57%). Average net performance: 0.39%
- Negative Fridays: 12 (43%). Average net performance: -0.63%
- Average net Friday performance YTD: -0.05%.
NFP Fridays in general over the last 12 months:
- Average net performance across all NFPs: 0.37%
- 10 of 12 (83.3%) NFPs have been positive.
- Average net performance of positive NFPs: 0.58%
- 2 of the 10 that were positive gapped up but finished below the open (inside the gap)
- 2 of 12 (16.7%) NFPs have been negative.
- Average performance of negative NFPs: -0.69%
NFP Fridays in 2014:
- Average net performance of all 2014 NFPs: 0.18%
- 5 of 7 NFPs (71.4%) have been positive.
- Average net performance positive NFPs: 0.53%
- 2 of 7 (28.6%) NFPs have been negative.
- Average performance of negative NFPs: -0.69%
NFP Fridays over the last year have been preceded by 6 up and 6 down Thursdays. On balance, no NFP Friday in the last year has followed a negative Thursday with a net change even close to today’s (-40 points): the nearest precedent is 11/07/2013’s 23-point drop, retraced to the point the following day. But despite this “unique” performance on the Thursday prior, tomorrow definitely has the calendar’s wind at its back: NFP has been a fantastic day to be long, up 83.3% of the time over the last year and 71.4% of the time in 2014.
That said, remember Fridays in general and NFP Fridays are not a sure thing. Buried in all these stats is the fact that net Friday performance has deteriorated slightly in 2014. The number of positive Fridays YTD is tracking with full 12-month period, but the performance in 2014 of those days is 0.39% v. 0.46%. A minor deviation statistically, but also consider that while the last 10 of 11 (since early May) are positive, they’re only averaging only 0.27%. Moreover, the last 4 NFPs (April-July) have been even money at 2/4, and average a -0.09% net performance overall.
These are emergent trends only and shouldn’t overshadow the broader dataset supporting positive Friday and especially positive NFP performance, but as any market professional knows, even empirically-grounded edges based around seasonality, calendar cyclicality and economic data releases are subject to arbitrage – just look at what happened to Tuesday. The Friday and NFP trends are well-established, but the “secret” of their performance is definitely out (I’m not the only one to notice these trends) and no one wants to be caught leaning too far in the wrong direction when (not if) the contrarian tide arbitrages these advantages away.
Trade ’em Well.
Twitter: @andrewunknown and @seeitmarket
Author holds no exposure to securities mentioned at the time of publication. Commentary provided is for educational purposes only and in no way constitutes trading or investment advice.


